Service Line Assessment Report > Service Line Insights > Encounter Details
Categories: Reporting, Service lines
Encounter Details
Here you’ll learn more about the visits within a given service line, including the types of encounters (inpatient, outpatient, emergency), sub-service lines used, and when and where the encounters took place (facility and market area).
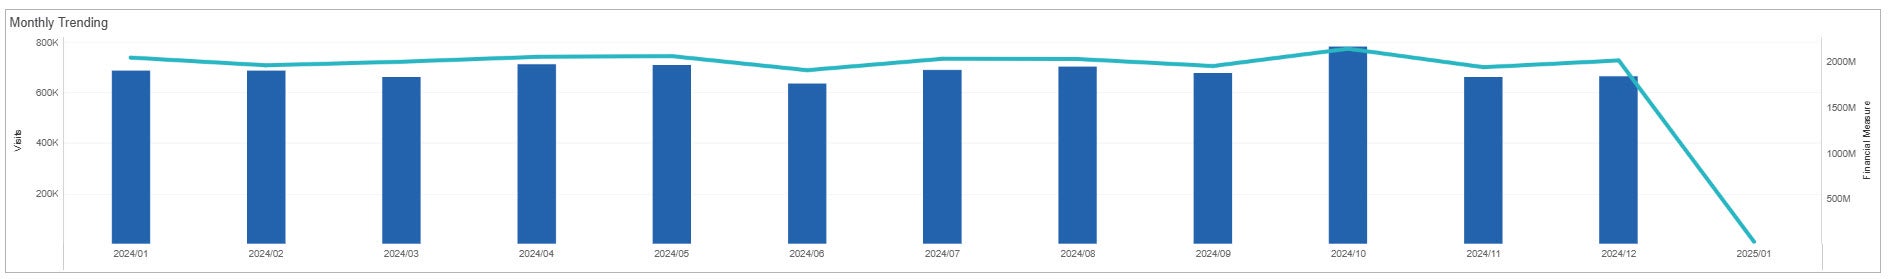
Monthly Trending
The monthly trending chart enables you to identify the seasonality of visits, assisting in making informed decisions about the optimal timing for running specific campaigns to maximize their impact.

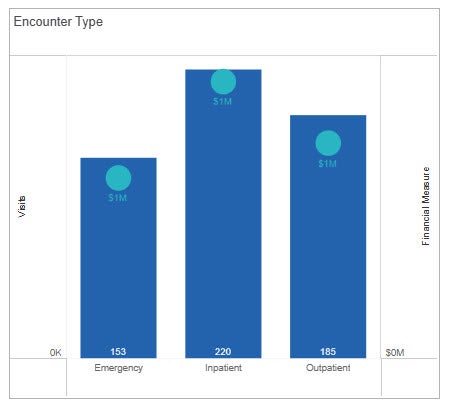
Encounter type
The encounter type chart displays the various types of encounters that occurred, along with the financial impact of these visits. It categorizes encounters into Emergency, Inpatient, and Outpatient types, allowing you to identify which type of visit has the most significant financial impact.
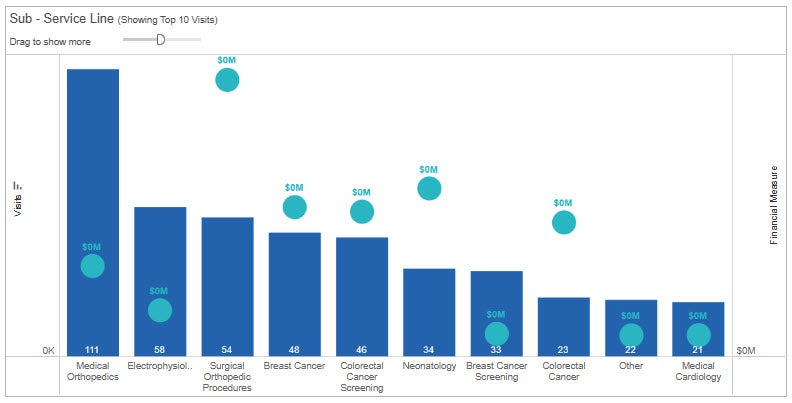
Sub Service Line
The Sub Service Line chart presents each sub service line along with the number of encounters and the financial impact of those encounters. This information is valuable for understanding which sub service lines are driving growth.
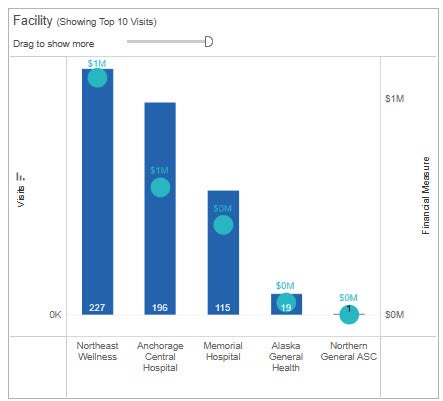
Facility
This chart illustrates the facilities where encounters occurred, along with the corresponding financial impact of those encounters. It serves as a valuable tool for identifying which facilities contribute most significantly to the overall financial picture.
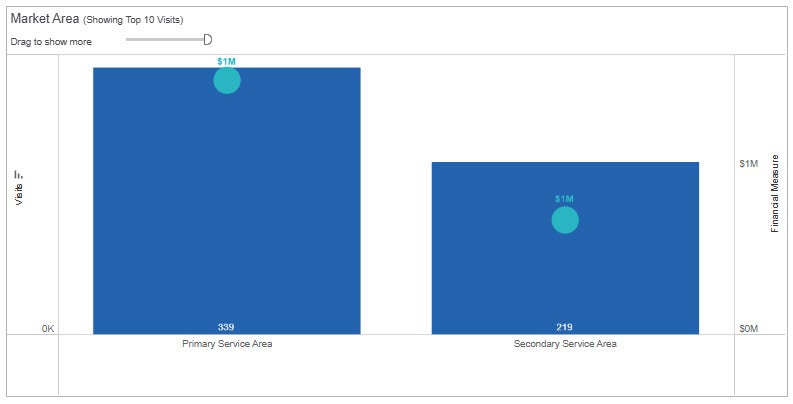
Market Area
The Market Area chart displays encounters in the market areas as well as the financial impact each market area had. Can be helpful to see which market areas have the largest financial impact.