Service Line Assessment Report overview
The Service Line Assessment Report helps you use data to identify and prioritize service lines based on the greatest opportunities.
Analyze the annual volumes, trends, and financial impact of your patients across service lines, then do a deep dive within the key service lines you’ve identified to:
- Understand the demographic composition of patients
- Pinpoint their geographic location
- Examine historical performance and seasonality of visits
- Assess the most common diagnoses and/or procedures
- Evaluate the appropriate risk models to use
Service Line Assessment Report types
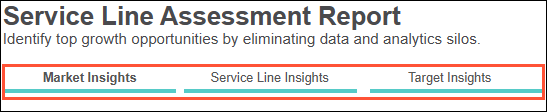
After launching the report (by clicking the arrow on the tile), you will see the 3 separate reports available in this bundle. These reports are meant to be used in a linear way as they build off each other and reveal the most robust insights.
Navigation & filters
The 3 reports are on separate tabs and you simply click the tab to progress from one report to the next and build your marketing story.
1. Market Insights
This tab is the best place to start analyzing where opportunities exist, because it provides insights helping you find and prioritize those prime service lines. Compare year-over-year trends, the value of growing a service line, and average financial value per visit across service lines. Use the in-line filters to further narrow your results.
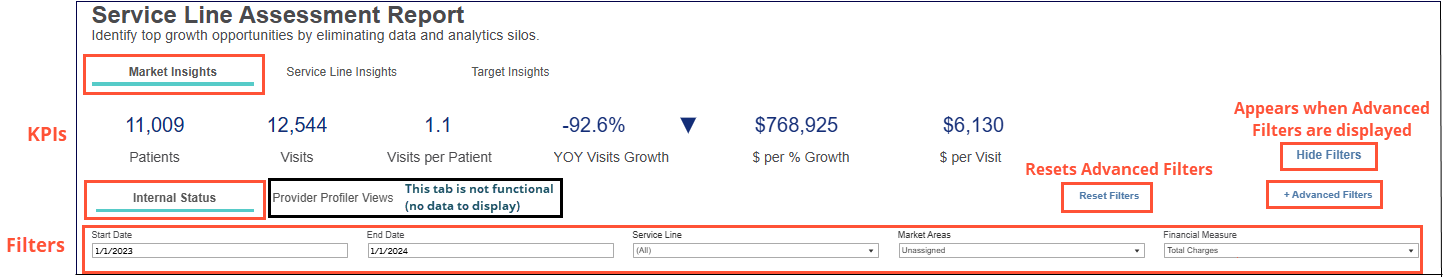
Market Insights Filters - impact:
Start date, End Date, Financial Measure:
- When updated:
- Results immediately recalculate
- When move to Service Line Insights report tab:
- Do not reset - results reflect the selected values
Service Line, Market Area:
- When updated:
- Need to click Apply for results to recalculate
- When move to tabs within or between reports:
- Do not reset - results reflect the selected values
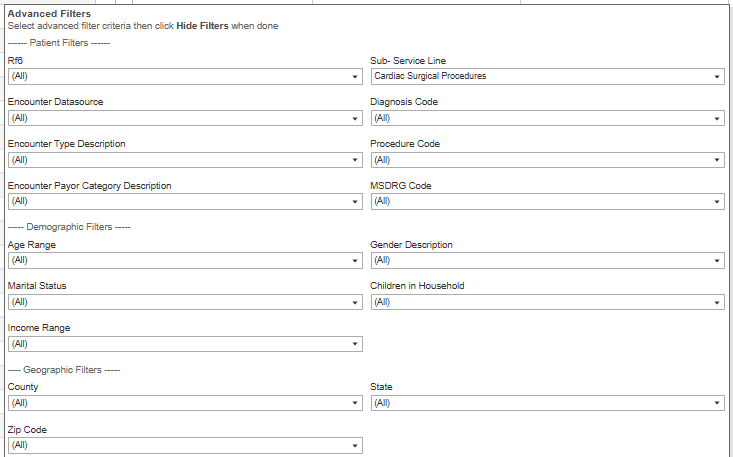
Advanced Filters:
- When updated:
- Results immediately recalculate
- When move to Service Line Insights report tab:
- Do not reset - results reflect the selected values
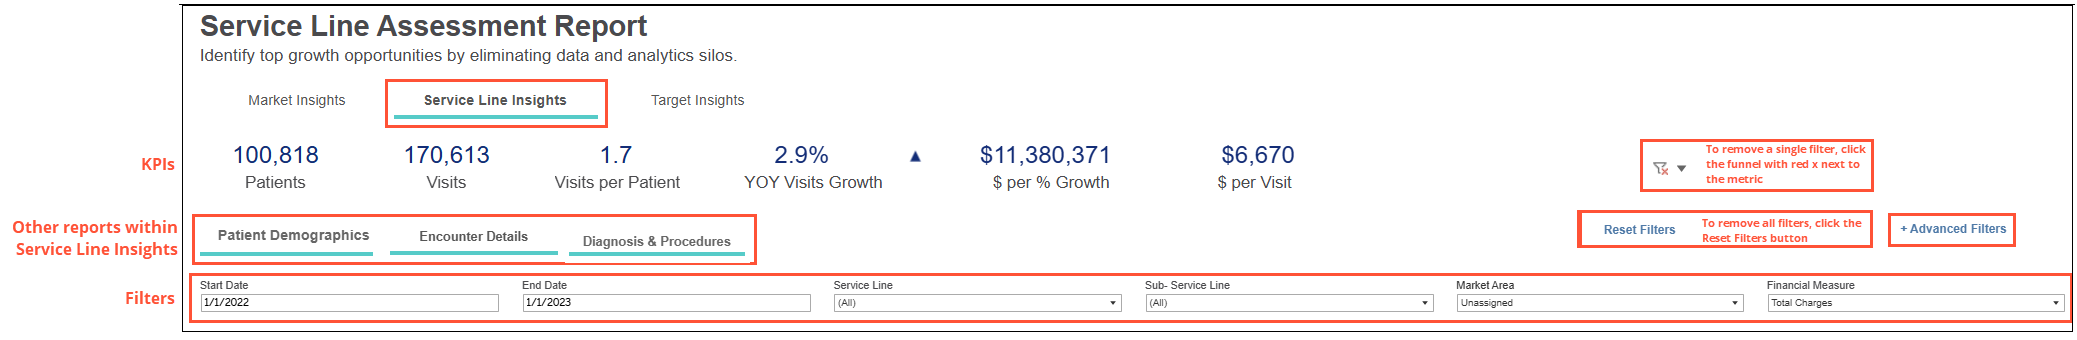
2. Service Line Insights
Once you’ve identified your high-priority service lines, you’re ready to investigate the patients within them. This report gives you in-depth insights into where they went for care and why. Analyze service line data within a particular geography, including patient demographics, monthly financial and patient trends, and visits by location and sub-service line. Use the in-line filters to further narrow your results.
Service Line Insights filters - impact
Start date, End Date, Financial Measure:
- When updated:
- Results immediately recalculate
- When move to tab within or between reports:
- Do not reset - results reflect the selected values
Service Line, Sub-Service Line, Market Area:
- When updated:
- Need to click Apply for results to recalculate
- When move to tabs within or between reports:
- Do not reset - results reflect the selected values
NOTE: Best practice is to use Service Line OR Sub-Service Line due to the logic used for Ignite’s Service Line mapping learn more
- Do not reset - results reflect the selected values
Advanced Filters:
- When updated:
- Results immediately recalculate
- When move to Market Insights report tab:
- Do not reset - results reflect the selected values
- Do not reset - results reflect the selected values
Service Line Insights includes 3 tabs, each of which returns relevant metrics based on your filtered criteria and displayed in interactive charts called dashlets. Explore a tab or click between tabs to discover actionable insights.
3. Target Insights
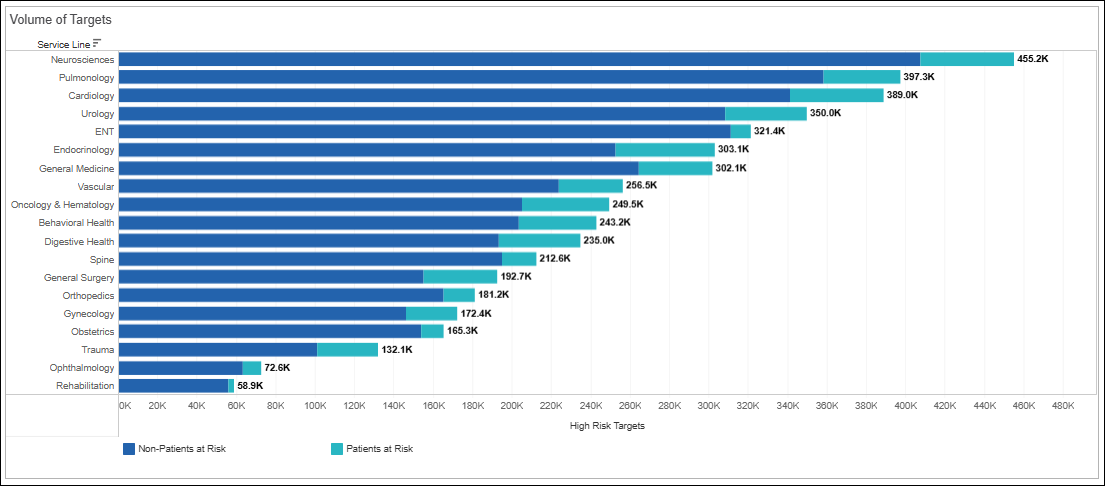
You’ve found the service lines to focus on, and learned more about who’s using them. Now you can evaluate the specific characteristics of those most in need of those services to build your target audience. Dig into your at-risk population to uncover the models to reach patients and prospects within each service line. Use the in-line filters to further narrow your results.
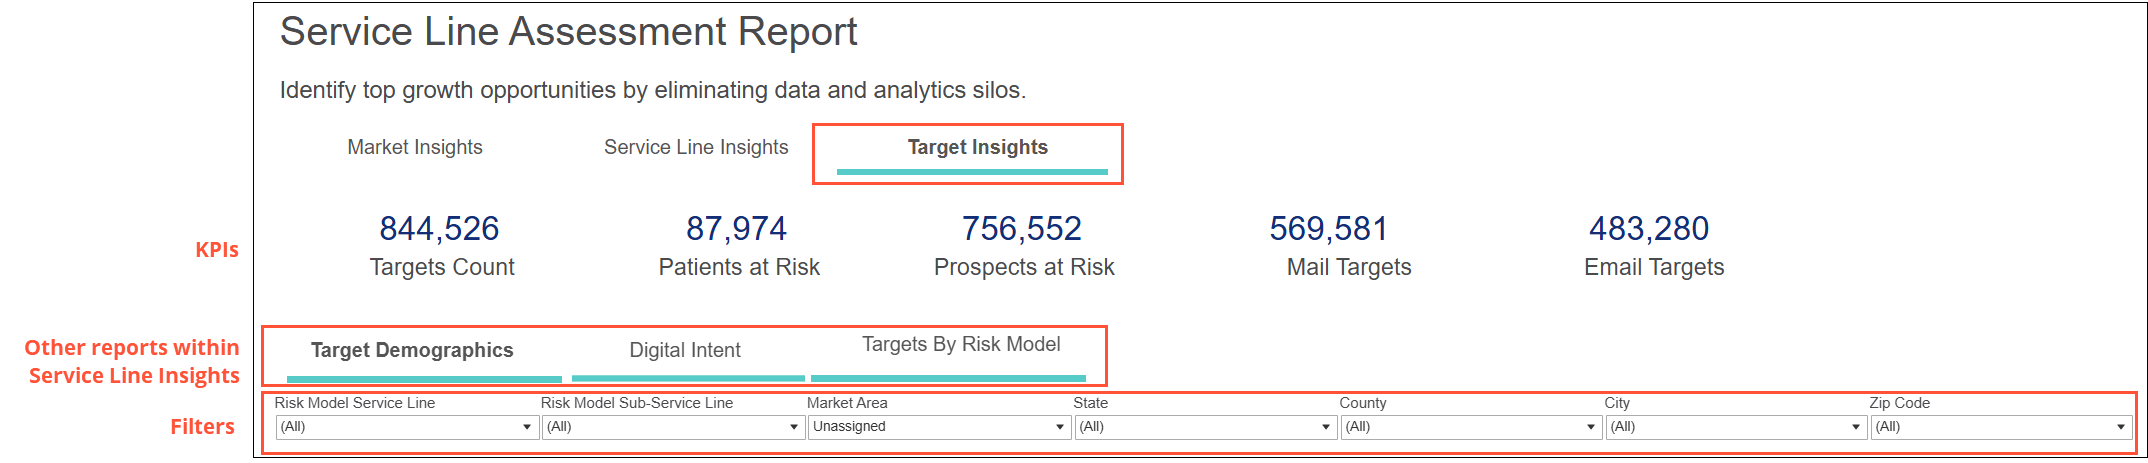
Target Insights includes 3 tabs, each of which returns relevant metrics based on your filtered criteria and displayed in interactive charts called dashlets. Explore a tab or click between tabs to discover actionable insights.