Consumer Profiler
The Consumer Profiler gives you an in-depth understanding of patients and prospects based on their shared demographic, geographic, lifestyle, and financial characteristics.
Launch your report
In Market Planner Insights, launch the Consumer Profiler report, which will open in a new tab.
Audience types
The Consumer Profiler features 2 audiences:
- Patient Type: Create an audience profile based on their current relationship (or lack thereof) with your health system, payor category, and/or the type of encounter(s) they’ve had.
- Consumer Geography: Compare profiles of consumers in and out of your service area or by distance to a facility.
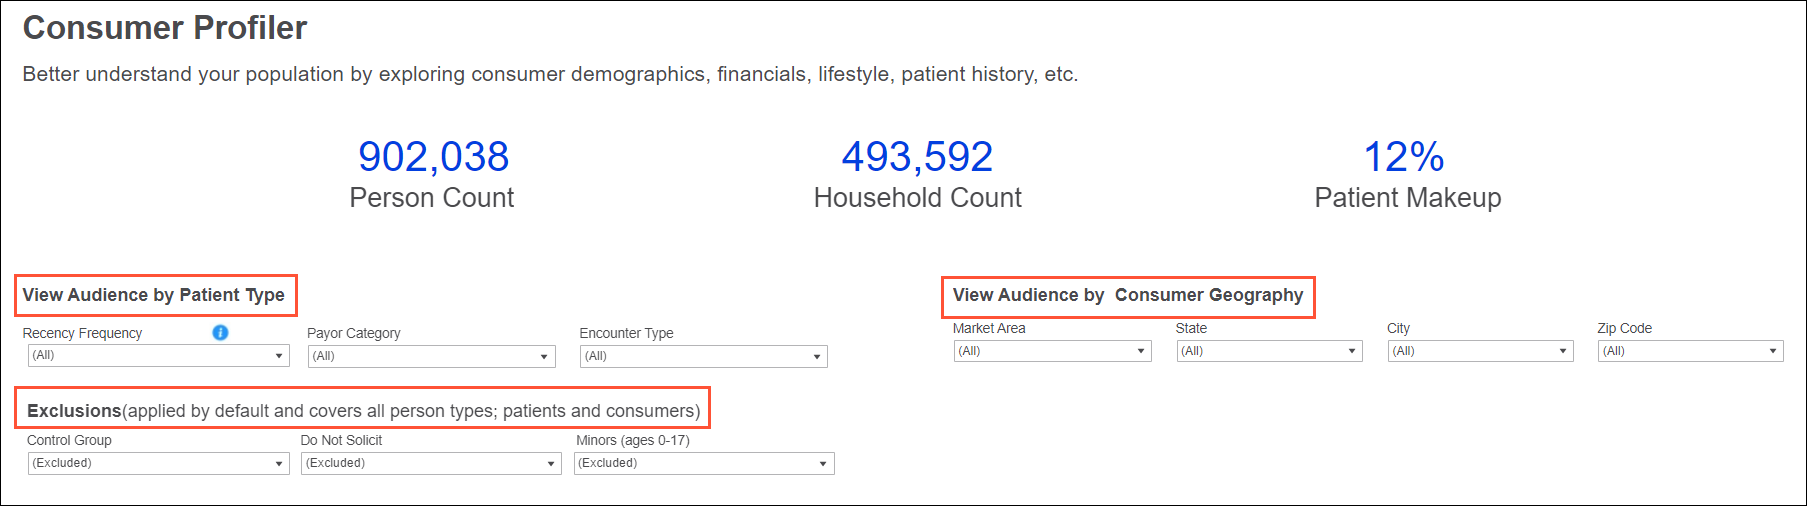
Filters
There are 3 sets of filters—1 for each of the audience types and 1 for exclusions—which can be used individually or in combination; for example, to see counts for commercial payers in your primary service area.
Use the dropdowns to select your filter criteria. Once applied, the key performance metrics and tabbed reports update accordingly.
Audience filters
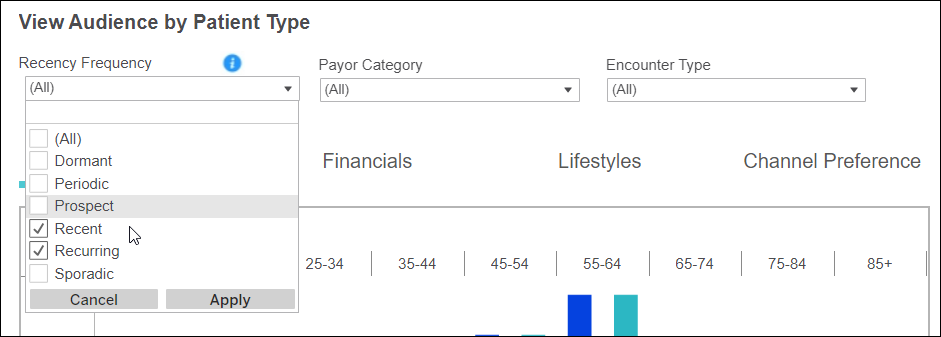
For Patient Type, you can filter by:
- Recency Frequency: Our proprietary segmentation model, which groups your audience into 1 of 6 segments based on how recently and frequently they’ve visited your health system. Hover over the blue Information icon anytime for segment definitions,
- Payer Category: Commercial, Medicaid, Self, etc.
- Encounter Type: Emergency, Inpatient, Outpatient
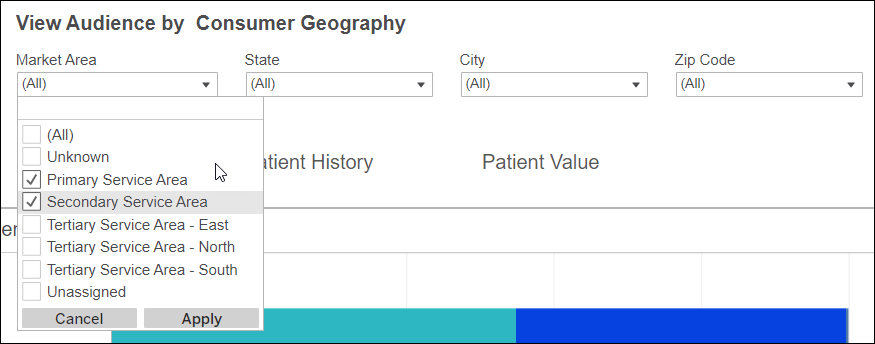
For Consumer Geography, you can filter by:
- Market Area: Primary, Secondary, etc., as defined by your organization
- State: State(s) within your market area
- City: City (or cities) within your market area
- Zip Code: Zip code(s) within your market area
Exclusion filters
Filter by:
- Control Group: Exclude or include individuals based on their membership in the enterprise control group
- Do Not Solicit (DNS): Exclude or include individuals based on their solicitable status (if any 1 channel—email, mail, or phone—is marked as DNS, the person will be excluded)
- Minors (0-17): Exclude or include individuals to assess pediatric campaign opportunities
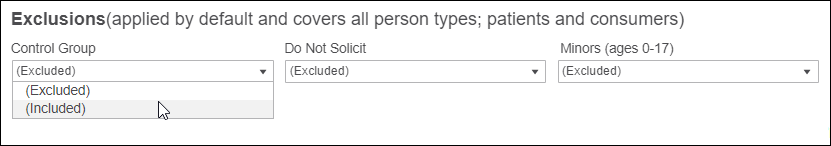
Like with Audience Insights, these criteria are excluded by default for your analysis. You can choose to include them for a broader view of your market makeup (demographics, financials, etc.).
Deceased individuals are automatically excluded.
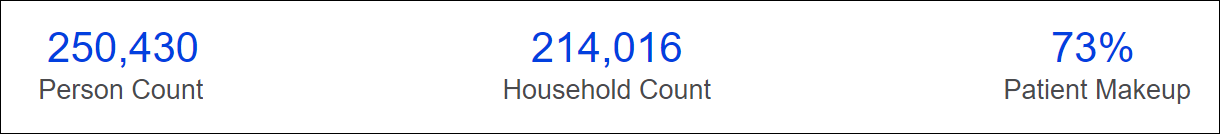
Key performance metrics
At the top of the screen, you’ll see key performance metrics on how many individuals, households, and patients meet your filtered criteria.
Tabbed reports
In the middle of your screen are 7 tabs, representing specific traits for your audience. Each tab returns relevant metrics based on your applied filters and displayed in interactive charts called dashlets.
Explore a tab or click between tabs to discover actionable insights.
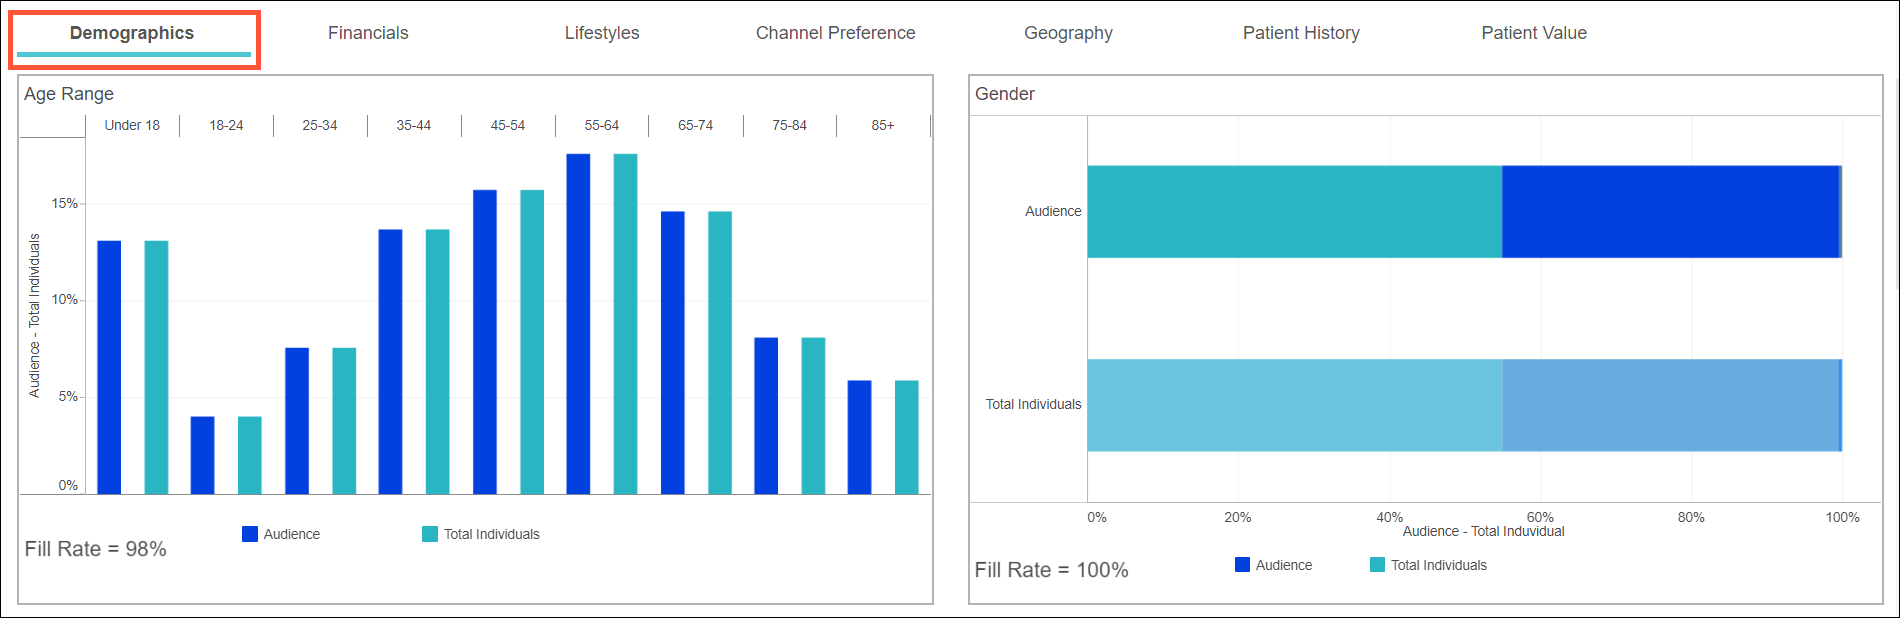
Demographics (default)
View a breakout of age, gender, marital status, languages spoken, and more audience essentials.
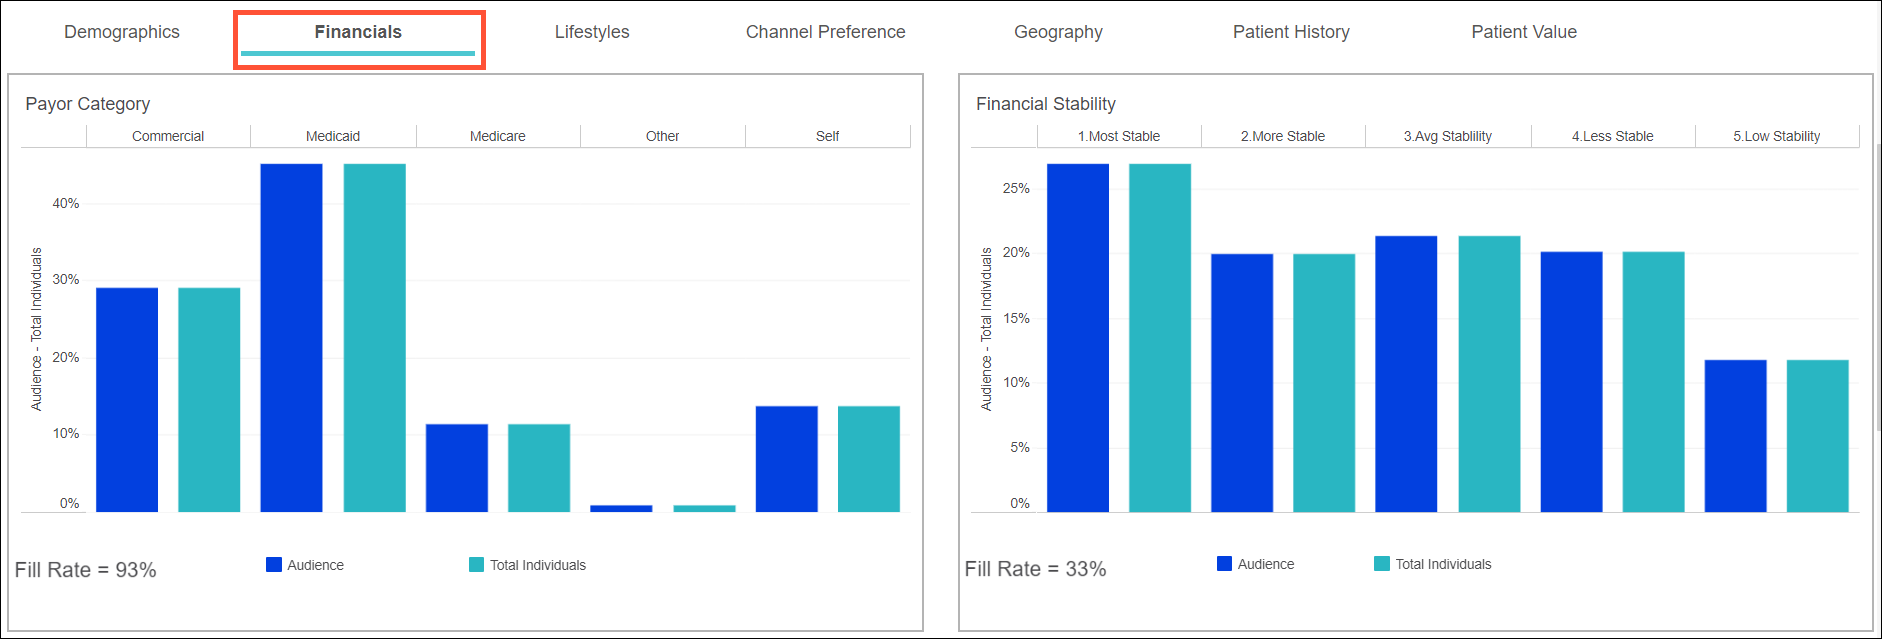
Financials
Assess your audience by payer category, household income and net worth, and overall financial stability to see who is most likely to reimburse for your services.
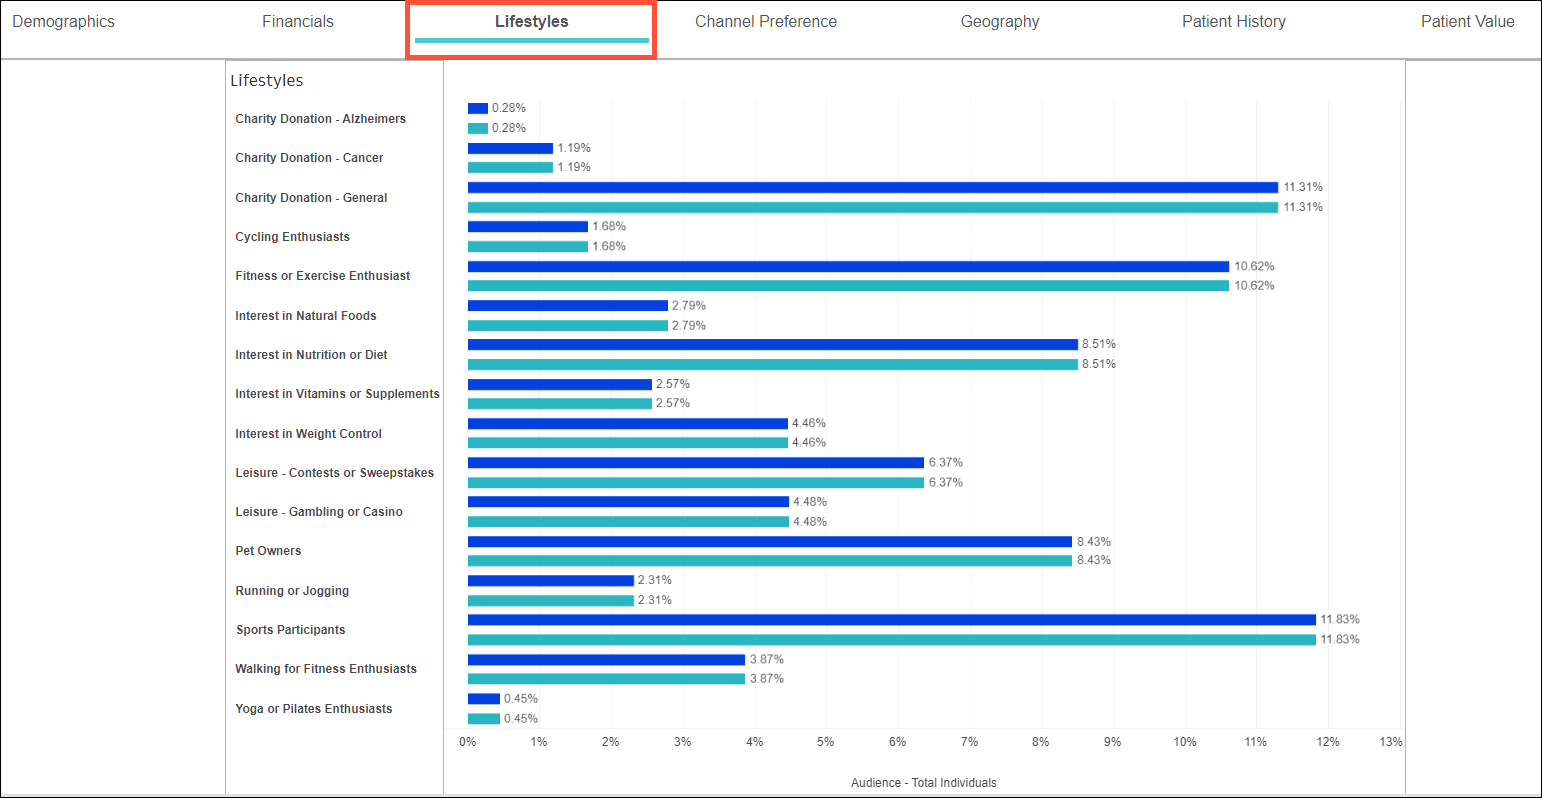
Lifestyles
Compare a wide range of attributes like charity donations, interest in fitness, and pet ownership, so you can choose the right type of audience for your campaigns. Note: The Lifestyles are each separate attributes provided in the consumer data and a person can belong to any number of them. This is different to Niches since they are modeled and each household is assigned only one Niche (all individuals in a household have the same Niche).
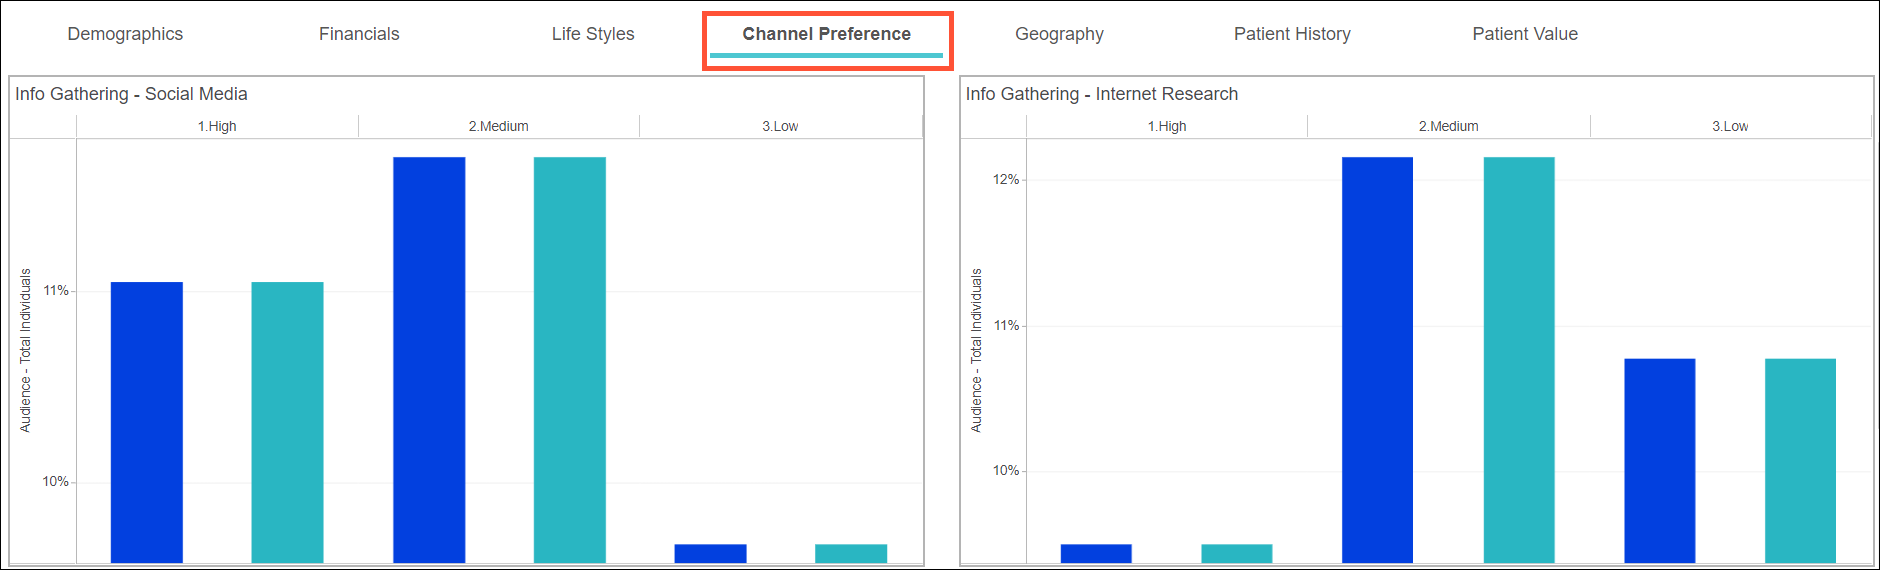
Channel Preference
See where and how your audience gets their information, then tailor your marketing tactics to reach them there.
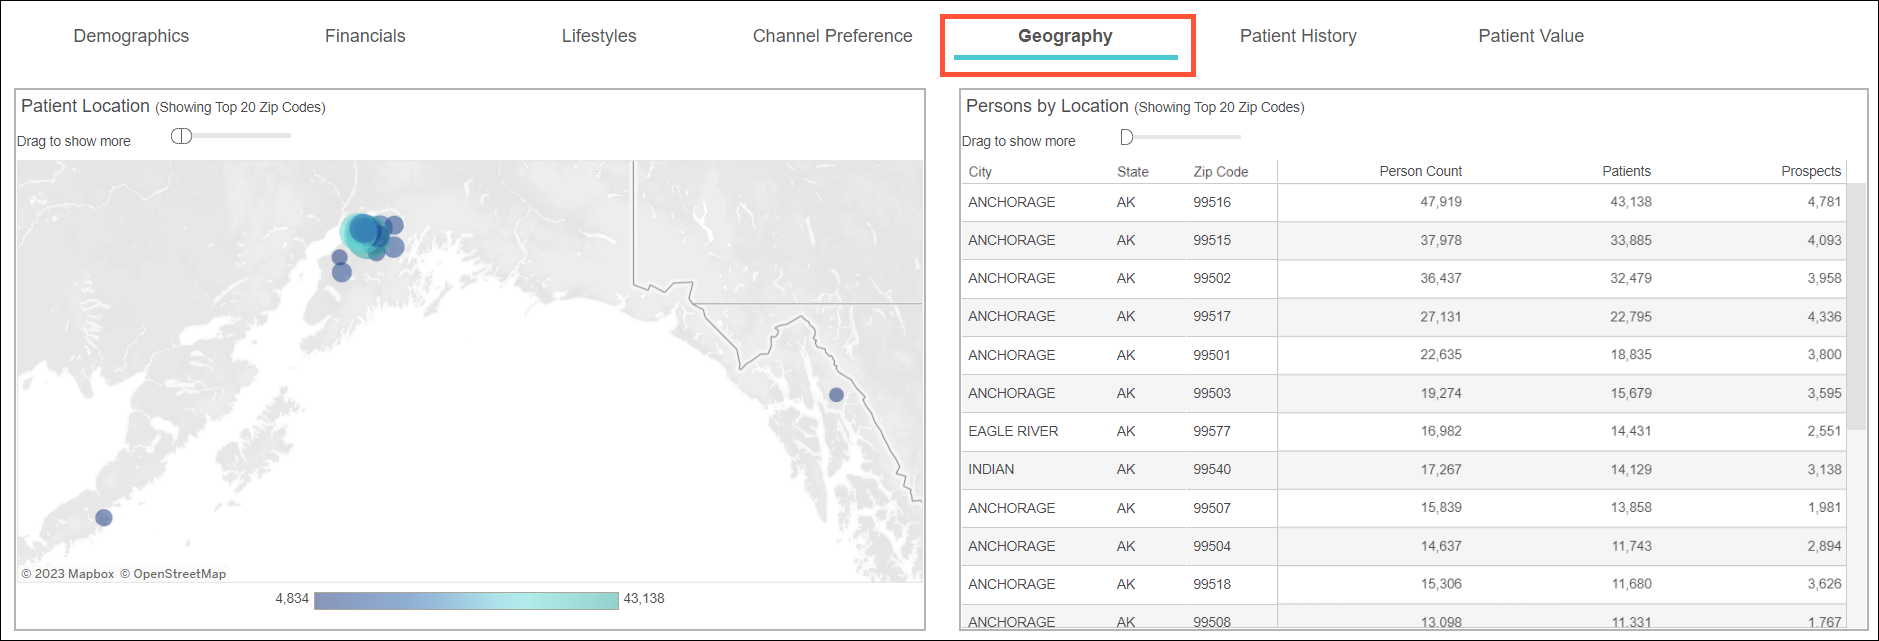
Geography
Learn more about patients in and outside of your primary service area and the health services they use most.
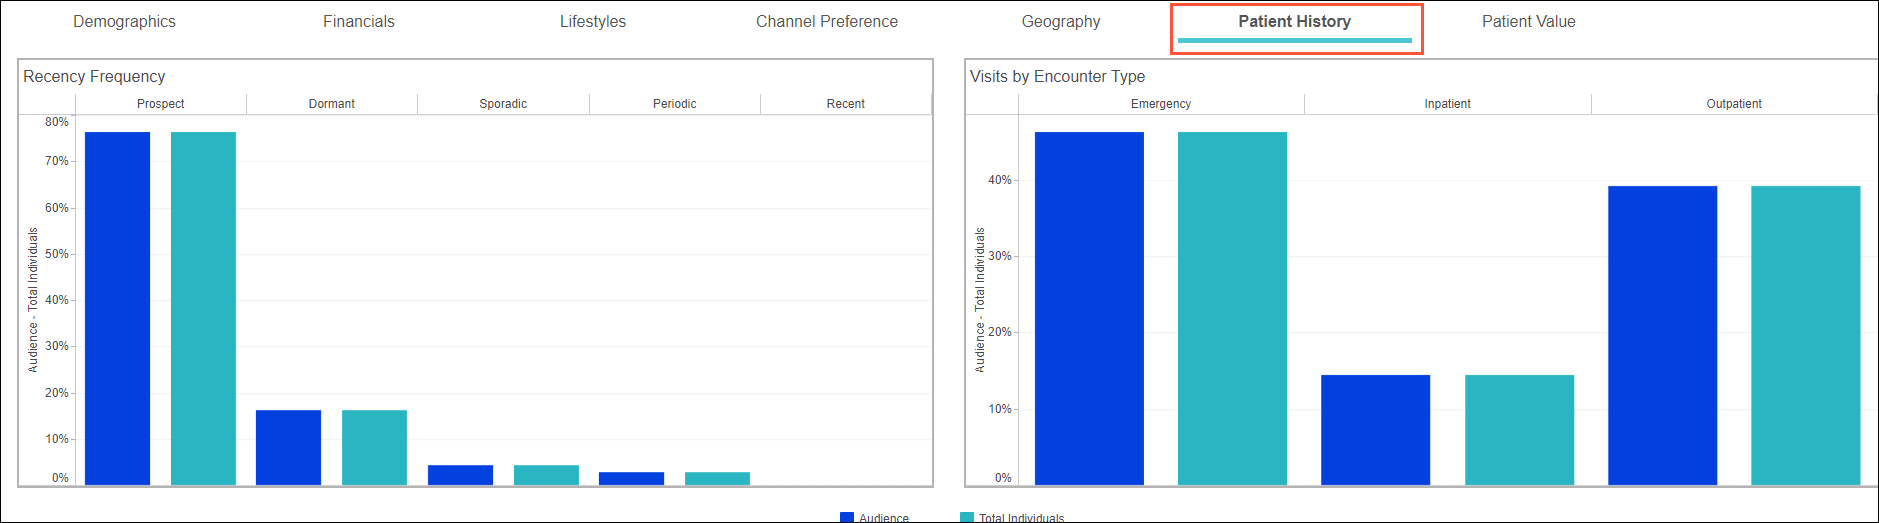
Patient History
Find where current patients are in their journey, and view their visits by encounter type and service line to understand their utilization patterns and medical needs.
Patient Value
Review average dollars per patient, visit, and household, using different financial measures (total charges, expected/actual reimbursement, contribution margin, etc.) to find your most profitable opportunities.
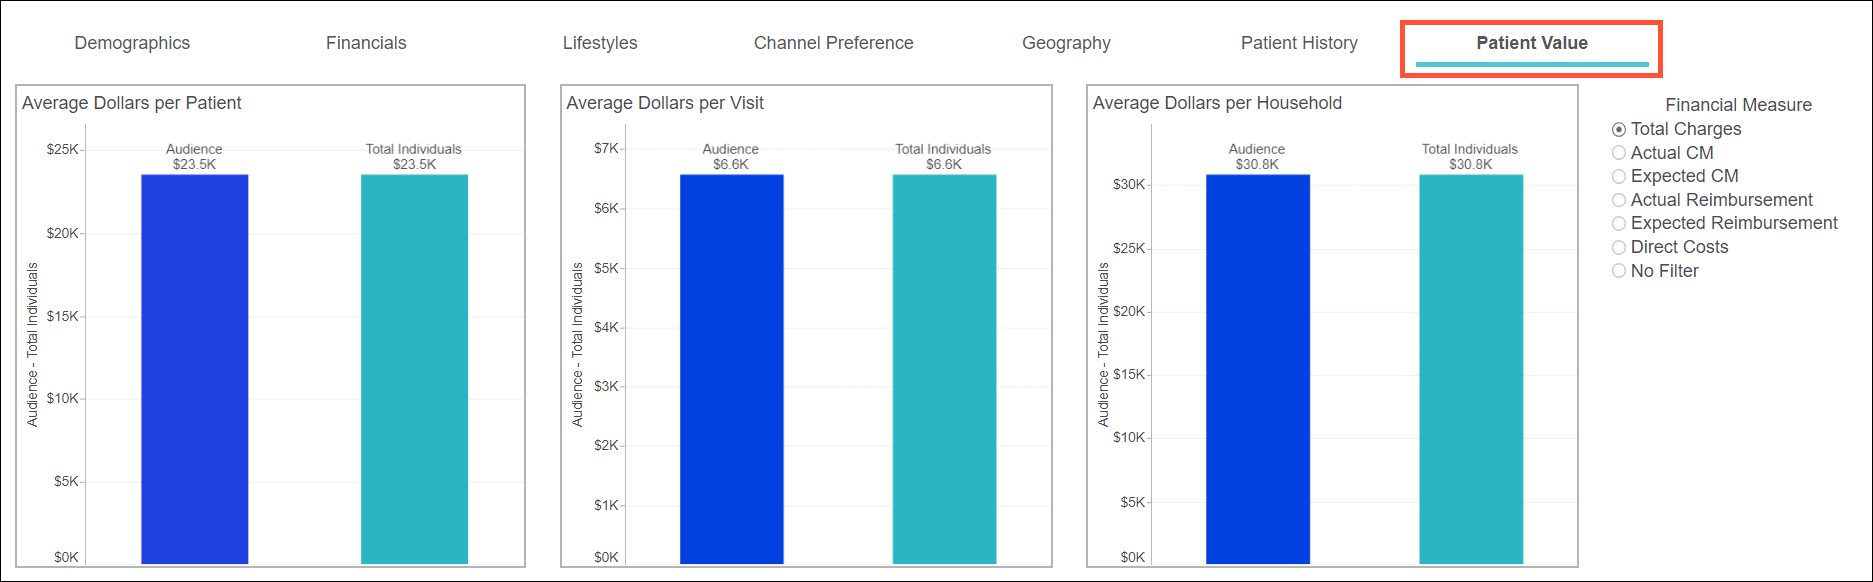
- Hover over the dashlets for more granular information.
- For select dashlets, you’ll see data represented for 2 groups: audience and total individuals. This shows how your selected audience compares to the general audience in your platform, which can help guide your marketing efforts.