QA Dashboard tab
The QA Dashboard tab shows active channels within a campaign by month and also includes a QA on all financial measures to help you decide which measures to use for your campaign reporting.
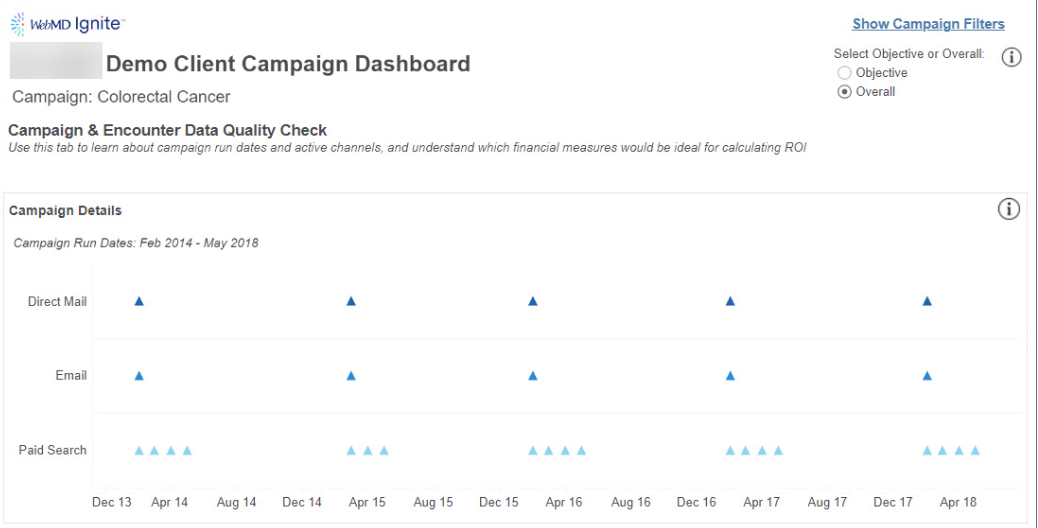
- Campaign Details: The graph shows campaign run dates broken out by channel to understand what months each channel had activity attributed to the campaign.
- Encounter Data QA: This section shows two charts:
- Average Financial Measure (Value per Visit): Indicates the average value being used per visit for each financial measure in the reporting.
- Financial Measure Fill Rates (Percent of total visits with fill rates or a non-zero value): Represents a fill rate for each financial measure in the data.
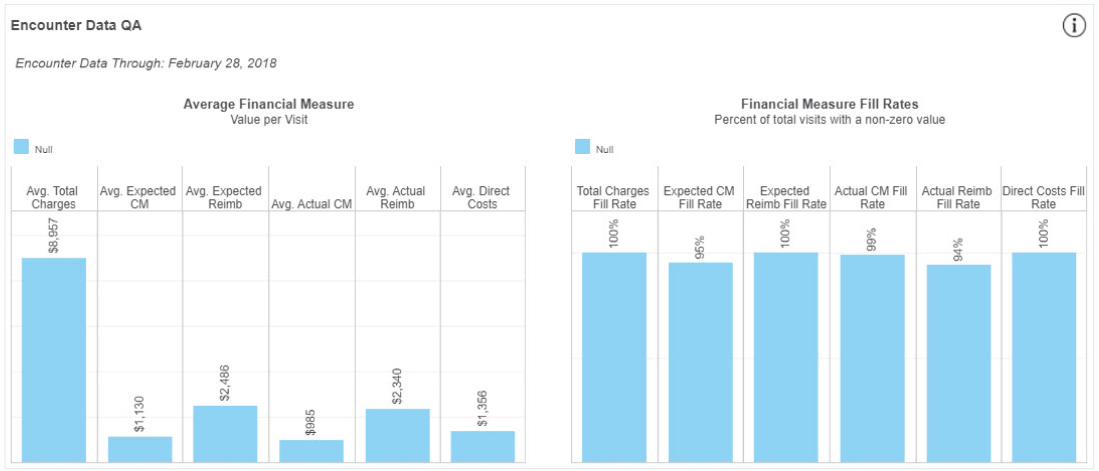
Tip: If fill rates are below 80%-90%, this could be an indicator that the ROI reporting in the campaign is impacted by underlying data availability.