Downstream Detail tab
To see a comparison of the Downstream Detail tab when reporting includes only Mastered records and when Unmastered records are included, click here.
For a detailed look into visits that happened after contact, the Downstream Detail tab includes matched leads or those that can be tracked for downstream activity from a campaign. Use this tab to see counts and financials by Service Sub-category, Procedures, and Diagnoses. This tab also includes top facilities and encounter type distribution of downstream patients.
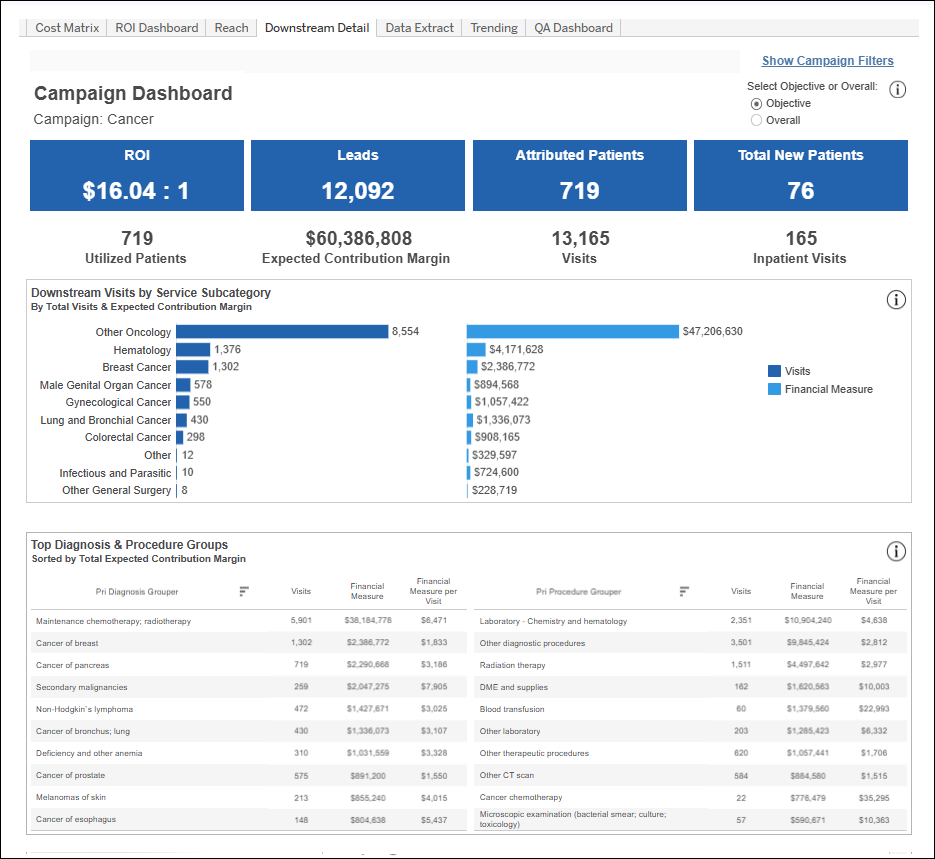
- Downstream Visits by Service Sub-category: This section shows the top 10 service sub-categories by encounter volume.
- The dark blue sub-categories on the left are represented by volume. Click one of the subcategory names in the bar graph such as “Colorectal Cancer” if you’re curious what those visits in the campaign look like downstream in the rest of the reports of this tab.
- The lighter blue financial measures are included in a separate bar to the right of each for comparison.
- Top Procedures & Diagnoses Groups: This section shows the top 10 procedure and diagnosis groups by total financials.
Each column in this section is sortable. For a list of all procedure codes and diagnosis codes, see the Data Extract section.
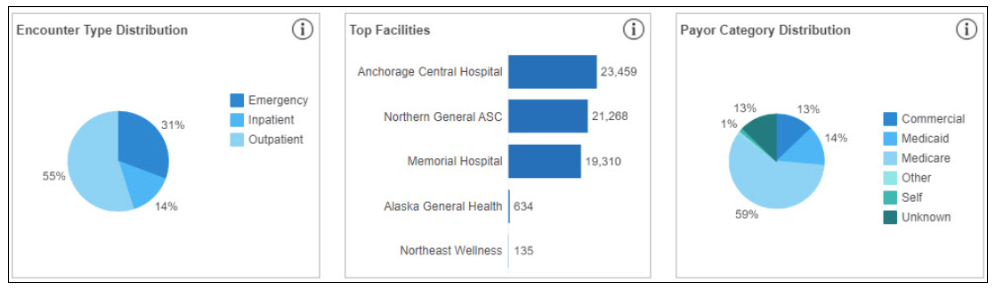
- Encounter Type Distribution: Breakdown of Emergency, Inpatient, and Outpatient visits based on campaign selection criteria.
- Top Facilities: List of up to the top 5 facilities with visits based on campaign selection criteria.
- Payor Category Distribution: Grouping of Commercial, Medicaid, Medicare, Other, Self, and Unknown payor categories based on campaign selection criteria.
- Downstream Visits by Facility: Shows all facilities with visits based on your selected campaign criteria. Facilities are listed in descending order, from most visits to least, and broken out by Visits, Utilized Patients, and the Financial Measure used.
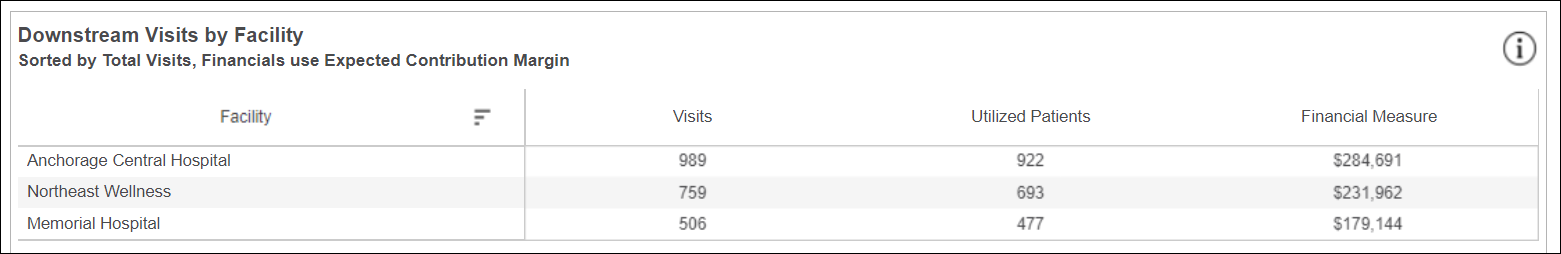
There is no limit to the number of facilities that can be displayed in the table. Use the right scroll bar as needed to view all.