Trending tab
To see a comparison of the Trending tab when reporting includes only Mastered records and when Unmastered records are included, click here.
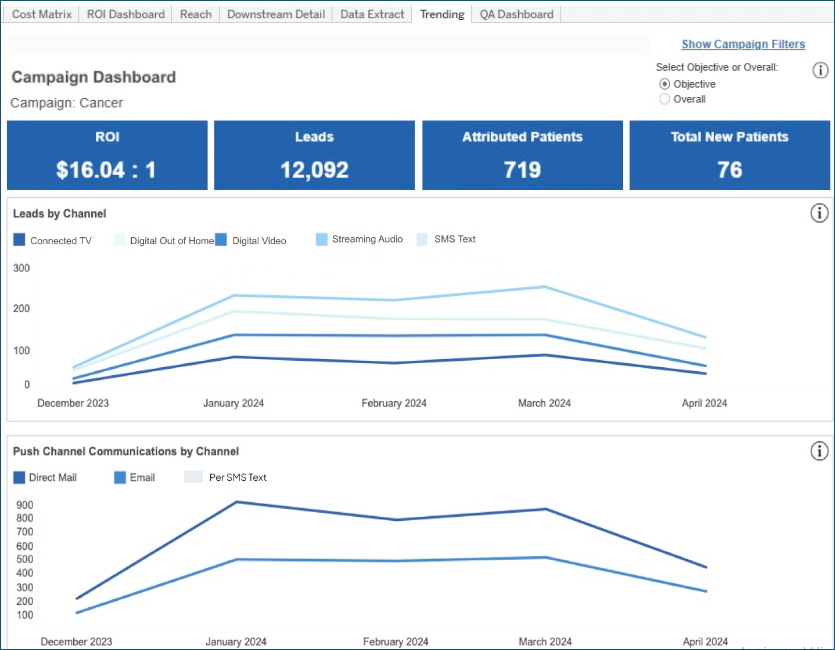
The Trending tab helps you understand campaign performance month over month over the duration of the campaign.
- Leads by Channel: Total activities associated with the campaign (calls, forms, HRAs, and custom activities) by channel and month-year.
- Push Channel Communications by Channel: Number of communications by push channel and month-year.
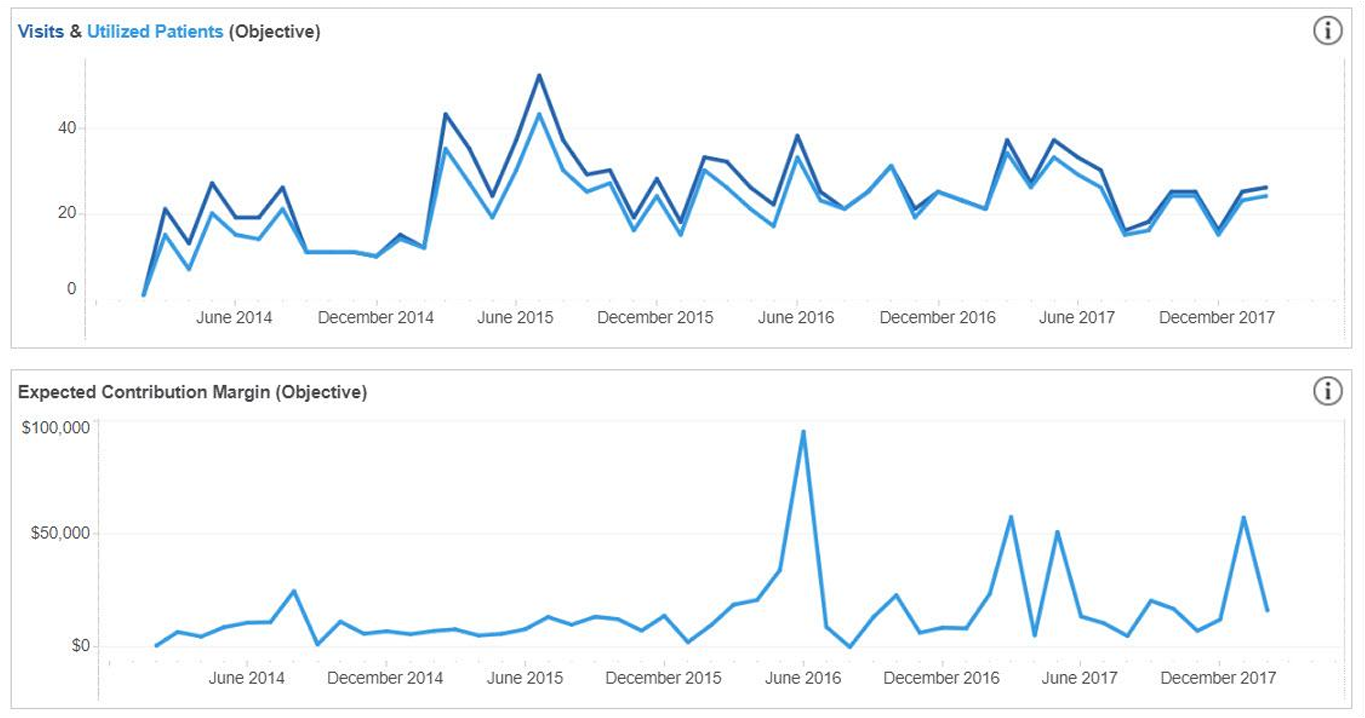
- Visits & Utilized Patients: Number of downstream visits and patients by month-year.
- Shows objective and overall, depending on which toggle option is selected
- One patient may appear in multiple months
- Financial Measure: Total financials from downstream visits by month-year.
- Displays the financial measure selected in Campaign Settings
- Shows objective and overall, depending on which toggle option is selected
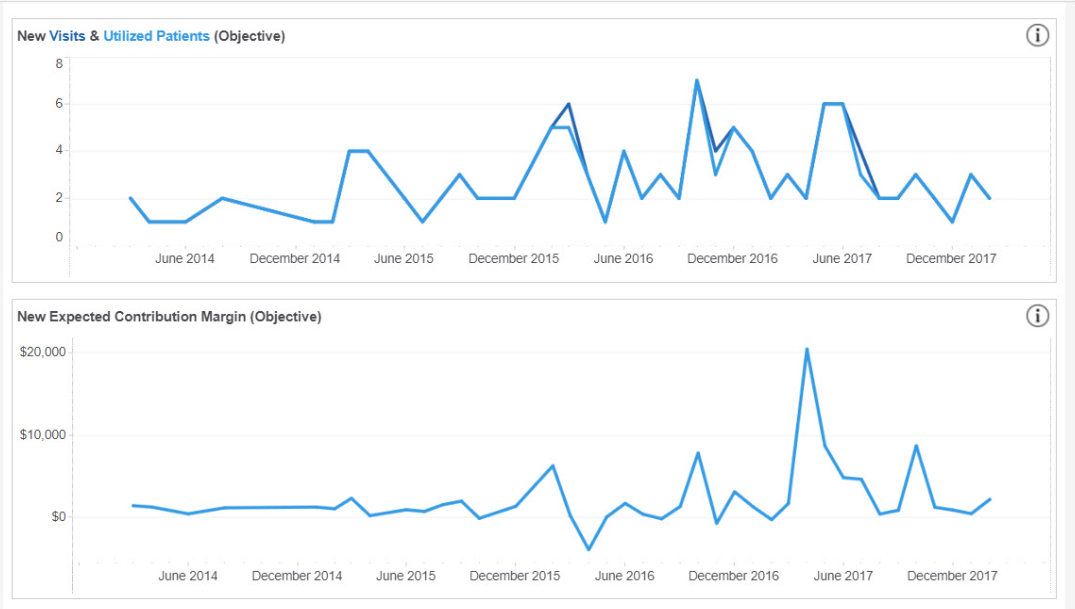
- New Visits & Utilized Patients: Number of downstream visits from new patients and new patient volume by month.
- New patients are defined as individuals whose last encounter with the health system was 36 months or more before the first interaction with the campaign. A patient identified as new at the start of the campaign holds the new patient status for the duration of the campaign.
- Shows objective and overall, depending on which toggle option is selected
- One patient may appear in multiple months
- New Financial Measure: Financials from new patient visits by month-year.
- Displays the financial measure selected in Campaign Settings
- Shows objective and overall, depending on which toggle option is selected
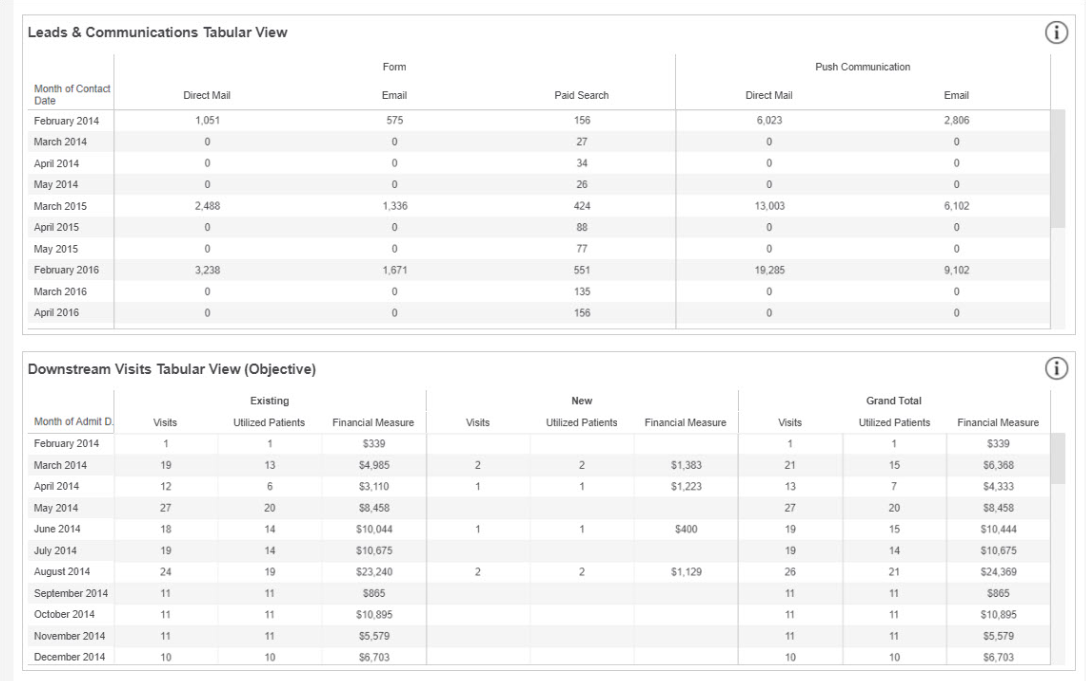
- Leads and Communications (Tabular View): Charts 1 and 2 above broken out by channel and month-year in table format; allows for easy download.
- Downstream Visits (Tabular View): Visits, utilized patients, and financial measure by patient status (new vs. existing) and month-year in table format; allows for easy download.
- Shows objective and overall, depending on which toggle option is selected
- Displays the financial measure selected in Campaign Settings
- One patient may appear in multiple months
- Grand totals for each month:
- Total visits = sum of existing and new visits by month
- Total utilized patients = sum of existing and new utilized patients by month
- Total financial measures = sum of all financial measures by month