Download a Data Extract and create a PivotTable
As you view Campaign Reporting, you may want to break out reports using different views of the data. You can do this by accessing the Data Extract tab and downloading into an Excel file and create a pivot table.
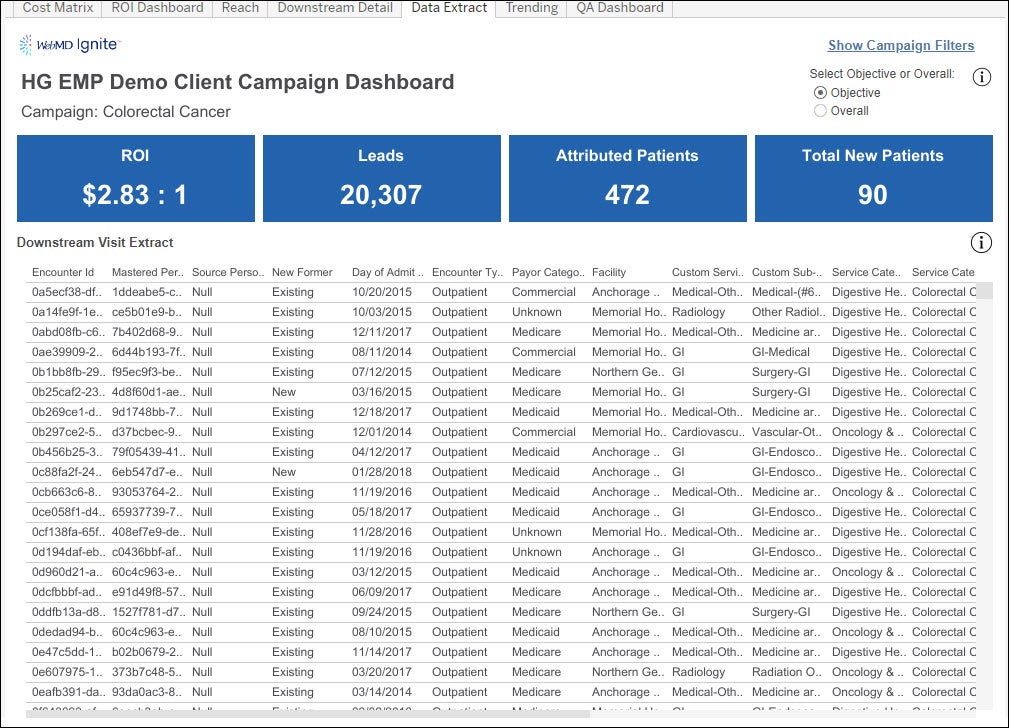
When logged into your campaign’s dashboard, navigate to the Data Extract tab. Here you’ll see a table of downstream visits and their information. You may select Objective or Overall here, depending on which view you are interested in . Use the Download button on the top right corner to extract this data into Excel or CSV file.

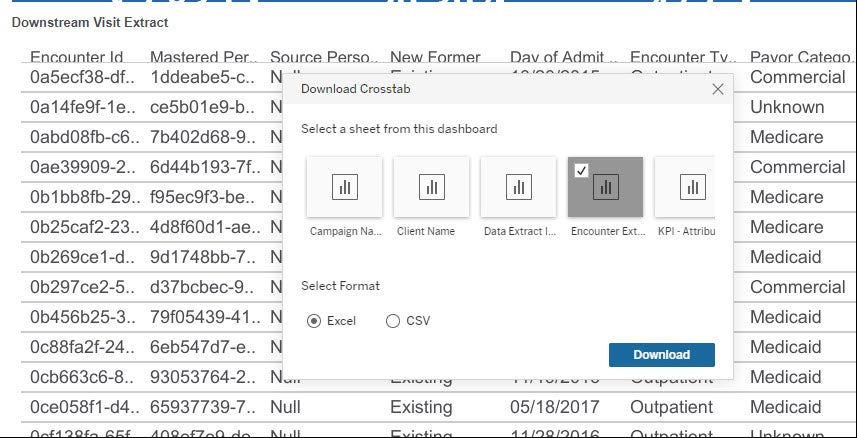
Download Format: Crosstab
Select a sheet: “Encounter Extract (Obj)” or “Encounter Extract (All)” sheet, depending on which view you are in.
File Format: Excel or CSV
Click: Download
This will kick off the download, and you may access the file from your Downloads folder.
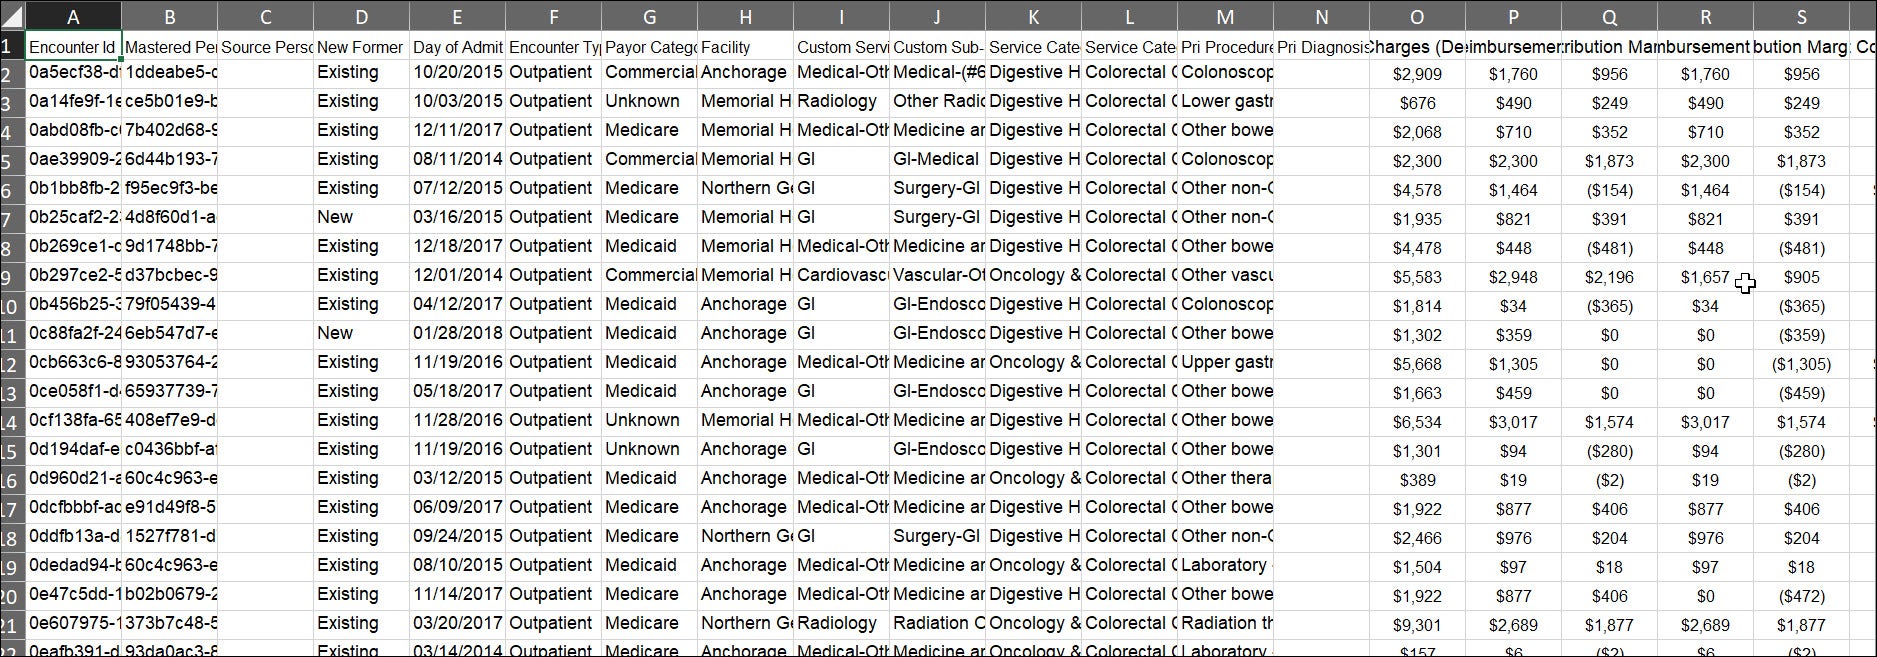
To make a PivotTable, select the full data range as shown below.
Go to Insert → PivotTable → From Table/RangeTable/Range: Leave as is Location for the PivotTable. Choose New Worksheet. Click Ok.
You should now see a PivotTable layout on a new tab in your Excel or CSV file.
On the right here, you can see all the fields from your Data Extract.
You can drag these fields into one of 4 areas:
Filters: If you want to filter your data down, you can use this.
As an example, if you’re interested in only Digestive Health visits, you can drag Service Category in to Filters, and select Digestive Health
Rows & Columns: This is where you would drag your categorical column. In our example here, that would be Facility. You may drag it into Rows or Columns depending on the intended layout.
Values: This is where you can drag perform aggregations such as count of visits or sum of reimbursements.
Let’s say we want to see:
Count of visits: Drag Encounter Id (the unique Visit ID) into Values. You’ll notice that it automatically uses the Count aggregation on this field.
If Excel uses an incorrect aggregation, you may fix that by clicking on the drop down → Value Field Settings, and select the correct aggregation. To edit the number format, click on Number Format, and select the appropriate format. Sum of Expected Reimbursement: Drag Expected Reimbursement into Values again.
Again, Excel was intuitive and used Sum as the aggregation automatically, so we don’t need to make any changes here to reorder your PivotTable, click into Row Labels → More Sort Options → Select Ascending or Descending depending on the view you want as another example, if you’re interested in looking at downstream visits by Custom Service Line, replace Facility with Custom Service Line, and follow the same steps as before.
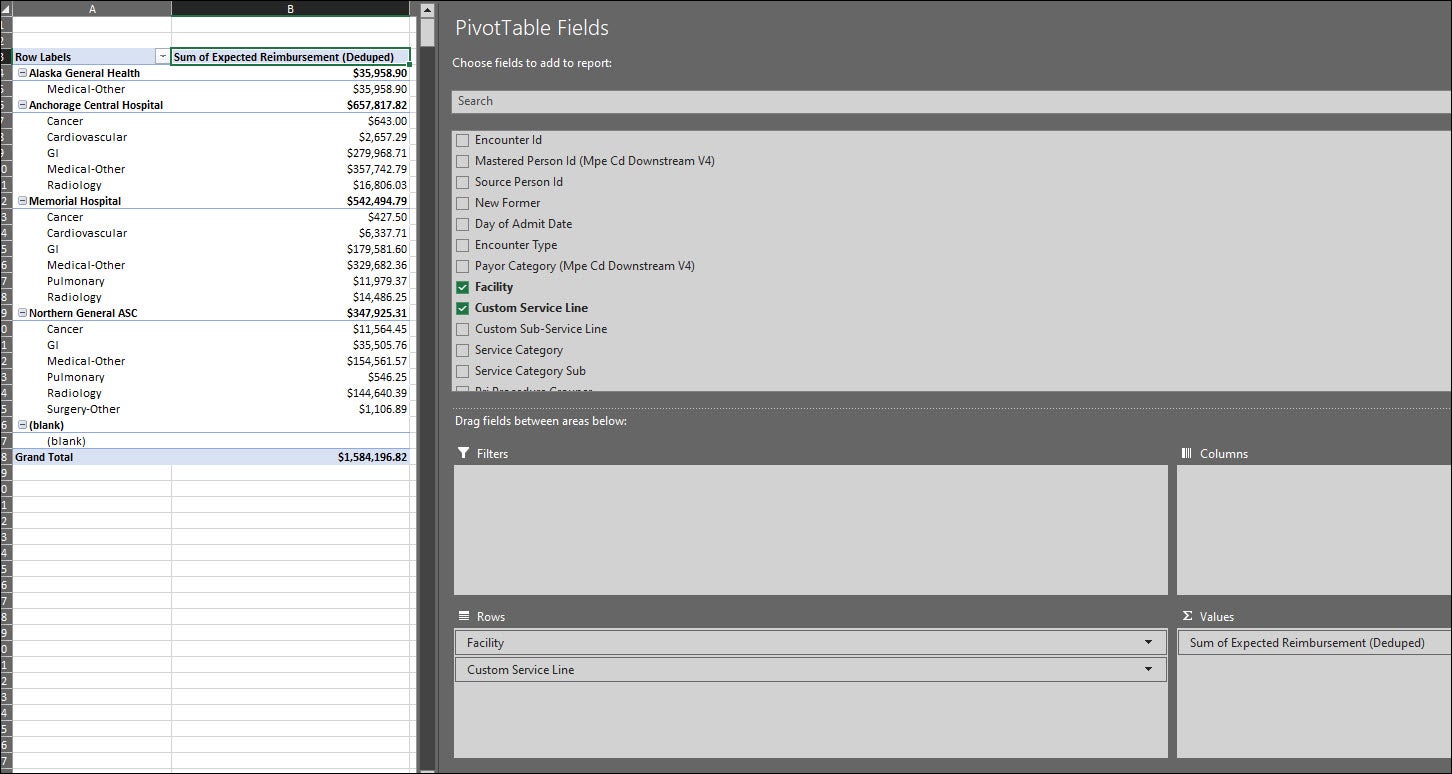
It is also possible to do multi-level pivot tables. For example, if you’d like to see what the Facility breakdown is for each Custom Service Line, you can drag Facility under Custom Service Line in Rows, and it will give you the facility split within each service line. A few points to note:
- The Data Extract tab is unique at the Encounter ID level, but not at the Person ID level. If a patient has multiple downstream visits, then all of that person’s downstream visits are included in the Extract. This means that when we do a Count of Person IDs, these may include duplicates, and will not be unique counts. It is possible to get a Distinct Count using the “Add to Data Model” option in Excel. However, this feature is only available on Windows.
Now, let’s look at a couple different scenarios.
Scenario 1: You are able to see the Custom Service Line encounters in Campaign Reporting for by choosing the appropriate filters, but in order to analyze Custom Sub Service lines provided by your organization you can build out a PivotTable.
- Pull Custom Sub Service Lines into the Rows field
-
Pull Encounter ID into the Values field
You can now see the count of encounters in each Custom Sub Service Line.
Scenario 2: You may want to see a full list of facilities with downstream visits, or see all data associated with Facilities.
Now let's set the PivotTable up to see the full list of facilities with downstream visits.
- Start by pulling Facilities into the Columns field to present the facilities in the columns
-
Pull the Encounter ID to the Values Field.
You can pull in as many fields as you would like to the Values, Rows, Filters, and Columns areas.