Question
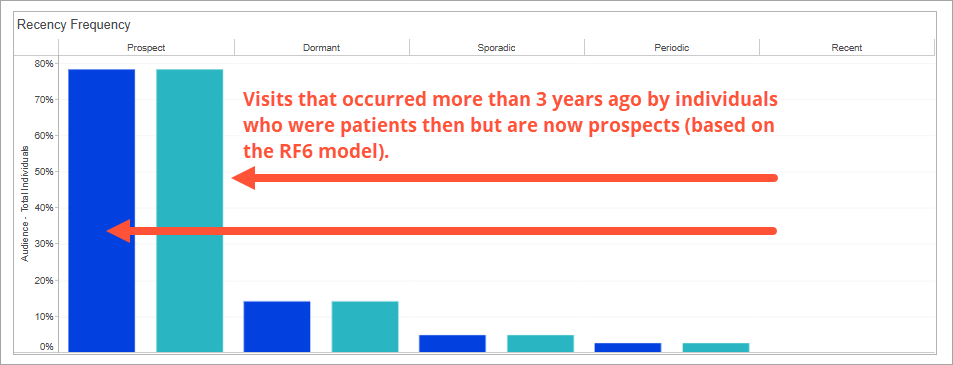
In the Recency Frequency bar chart in Consumer Profiler > Patient History, why do I see results for Prospects since they either won't have any visits in the past 3 years or any visits ever?
Answer
If your platform has more than 3 years of EMR data available, then it's likely current prospects did have encounters more than 36 months ago. That visit data is available on their record in the database and will populate the graphs, along with the visit data from current patients.
Related
Read more
Ignite Growth Platform
FAQ: Can I still access Campaign Performance Insights?
Read more
Ignite Growth Platform
FAQ: What's the difference between "expected" and "actual" contribution margin?
Read more
Ignite Growth Platform
A consistent lens on campaign success
Read more
Ignite Growth Platform
Aggregate Reporting
Read more
Ignite Growth Platform
Aggregate Reporting: Analyzing dashboard views
Read more
Ignite Growth Platform
Aggregate Reporting: Building an aggregate report