Release notes: November 28, 2023
In this release: New filter to analyze your market | Fixed
Now in Market Planner Insights: A new view of your patients and prospects
As you work through your annual planning, now you can leverage our Recency Frequency (RF6) model to better understand your market and maximize success in the year ahead.
Click the updated filter in the Consumer Profiler to access RF6, which replaces Patient Lifecycle. It’s the same model used as criteria in Audience Insights, giving you a more consistent way to analyze opportunities and build your audience in Ignite Growth Platform.
The model groups patients into 1 of 6 segments based on how recently and frequently they’ve had visits. By understanding a person’s relationship (or lack thereof) with your health system, you can identify opportunities for engagement and tailor your campaign strategies.
The segments are defined as:
- Recurring: At least 1 visit in the last 6 months and at least 3 visits in the last 36 months
- Recent: At least 1 visit in the last 6 months and less than 3 visits in the last 36 months
- Periodic: No visits in the last 6 months and at least 1 visit in last 24 months and at least 3 visits in last 36 months
- Sporadic: No visits in the last 6 months and at least 1 visit in the last 24 months and less than 3 visits in the last 36 months
- Dormant: No visits in the last 24 months and at least 1 visit in the last 36 months
- Prospect: No visits in the last 36 months
![]()
Fixed
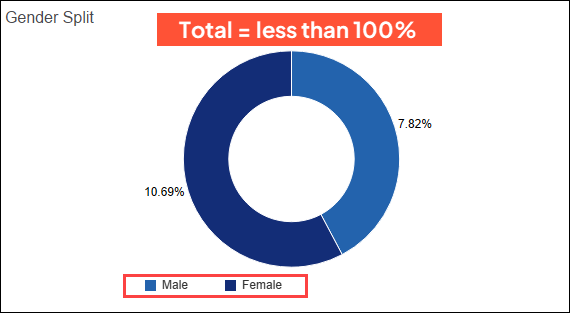
Also in Market Planner Insights, we fixed an issue where certain charts were not adding up to 100%—like in this example with the gender split for Male and Female:
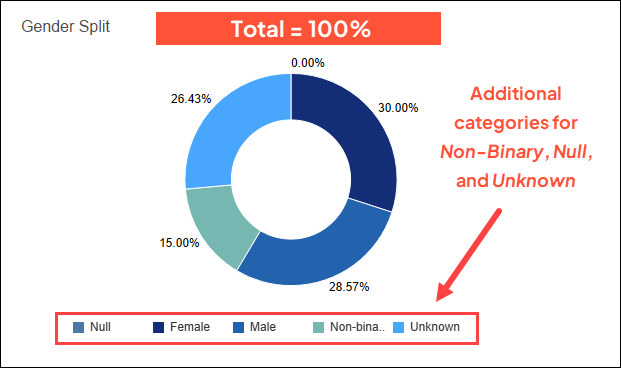
We found that additional categories for Non-Binary, Unknown, and Null, which factor into the total percentage, were being hidden. Now those are displayed in each chart, and all categories together equal 100%.
The 4 updated charts include:
Service Line Assessment
- Service Line Insights > Patient Demographics tab > Gender Split (donut chart)
- Target Insights > Target Demographics tab > Gender Split (donut chart)
- Target Insights > Target Demographics tab > Patient/Prospect Split (donut chart)
Consumer Profiler
- Demographics > Gender (bar chart)