
Introducing Aggregate Reporting: A multi-campaign view of performance
To kick off an exciting year for Ignite Growth Platform, we’re thrilled to deliver our #1 most requested feature. Now you can easily see the collective impact of your marketing efforts, providing the clarity and efficiency you need to demonstrate success at the executive level.
What it is
Aggregate Reporting is a powerful new module that allows you to group up to 20 individual campaigns into a single performance report. By rolling up campaigns based on your own chosen criteria, you gain a comprehensive view of how your initiatives drive organizational growth at scale.
The KPIs align with our standard campaign reporting while layering in a sophisticated methodology to de-duplicate results and ROI across your selected campaigns. Located on its own dedicated tab, the new experience includes a Report Builder and a multi-tab Dashboard — replacing Campaign Performance Insights with a more dynamic, user-driven tool for measuring total marketing effectiveness.
How it works
- Build your report
Access the Report Builder to search and select up to 20 campaigns for your roll-up. You can group campaigns by criteria like service lines, time periods, or regions, using filters to further refine your list by campaign status or objective. While the platform defaults to your organization’s preferred financial measure, you have the flexibility to select a different metric (e.g., Contribution Margin) before generating your report. Get step-by-step building instructions.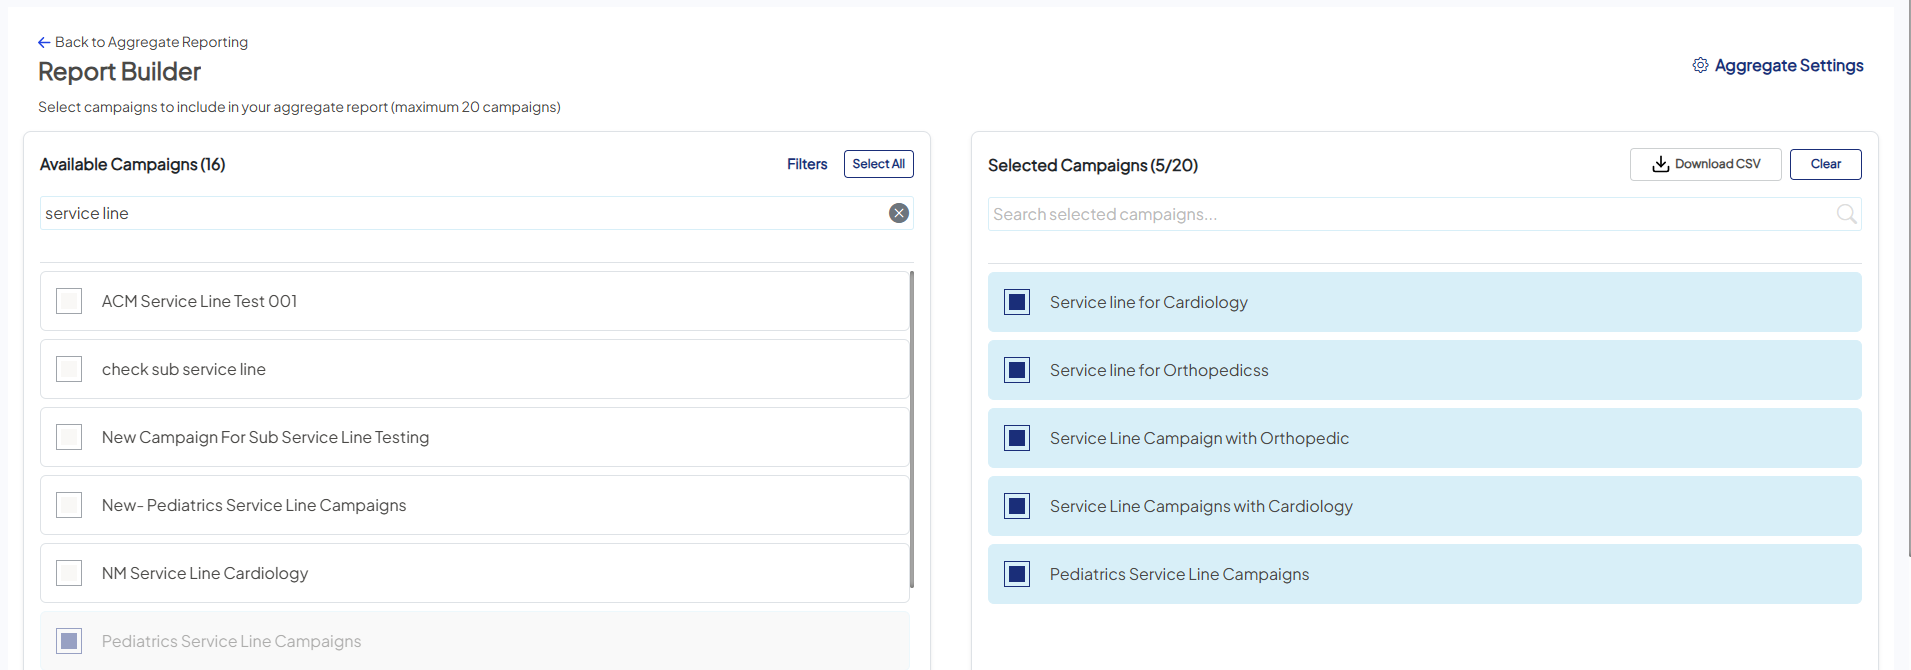
- Generate and de-duplicate
Once you Save and Run your report, the aggregate engine de-duplicates results across the entire campaign group. The platform runs in the background, so you’re free to navigate away to other tasks or start building your next report; your results will appear in your List View as soon as they’re ready.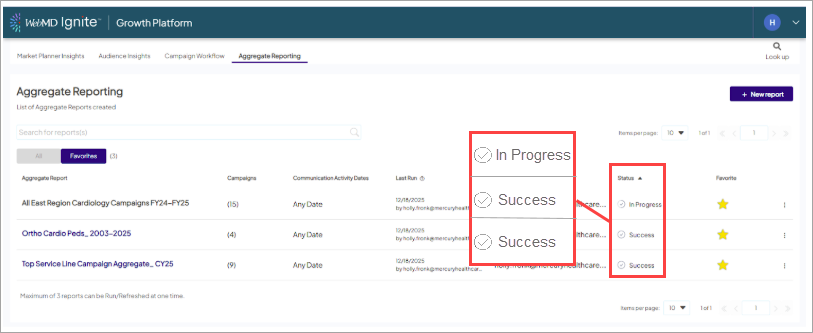
- Analyze performance
Open your completed report to access a comprehensive Dashboard with dedicated tabs for ROI, Reach, Downstream, and Trending.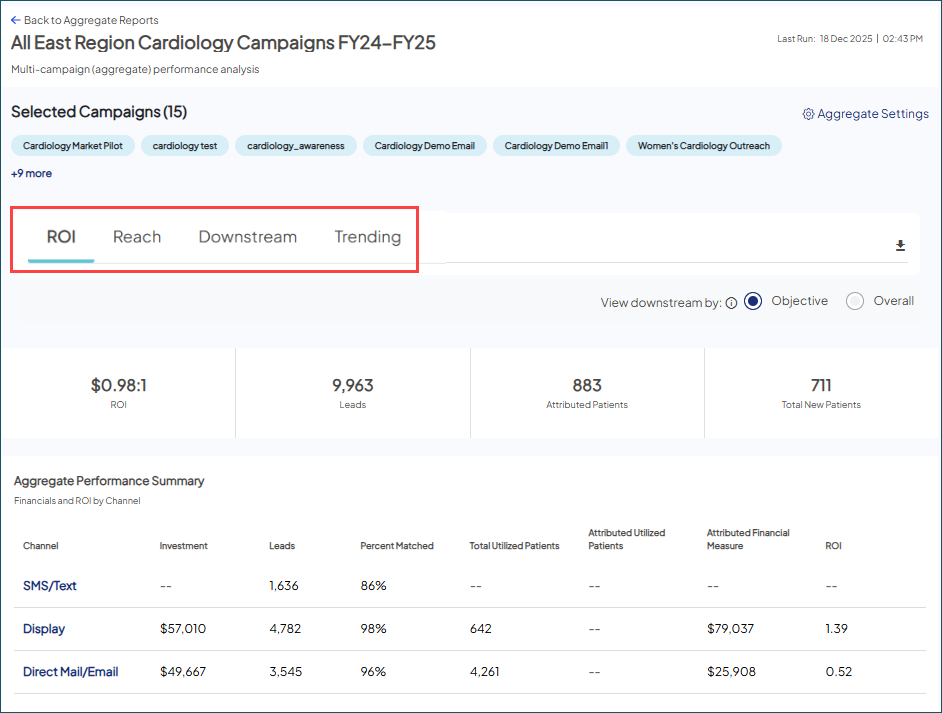
- Toggle your perspective: Switch between Objective (performance against specific campaign criteria) and Overall (system-wide success) views.
- Standardized accuracy: The platform applies "Behavioral First, Last Touch" attribution logic across all selected campaigns. It uses specific de-duplication rules — like anchoring patient age to the time of earliest contact — to ensure patients are not double-counted and provide a true apples-to-apples comparison. Learn more about our methodology.
- Built on a solid foundation: This reporting leverages the standardized campaign defaults we recently introduced: Household/Individual tracking, Age Range, and Visit timing. These foundational updates eliminate data variability across your campaigns, ensuring every initiative is measured against the same logic for a truly accurate multi-campaign analysis.
Why it matters
- Operational efficiency: This feature directly addresses a critical need: removing the manual work of "stitching" campaign data together in external spreadsheets. Now you can spend less time building reports and more time acting on the insights.
- Truth in numbers: Our proprietary engine handles the heavy lifting of patient de-duplication. If a patient interacts with multiple campaigns in your group, they are counted as one unique individual in the total ROI. This ensures your data remains accurate, transparent, and conservative.
- Executive-ready insights: By aggregating campaign reports, you can measure performance against higher-level organizational objectives and provide transparent, strategic data for leadership reviews.
- Performance and stability: Built for scale, this new reporting framework replaces legacy processing to ensure faster load times and consistent KPI retrieval. You get the speed you need to analyze even your largest campaign groups.