In this release: Faster campaign reporting | Financial measure defaults | Sort, zoom, and scroll report interactivity

Say hello to high-performance reporting
So long, spinning wheels. We've just supercharged your campaign reporting, providing the speed you need to make data-driven decisions and achieve your growth goals.
What is is
We heard your feedback on reporting load times, putting improved performance at the top of our 2026 roadmap. This faster framework renders your data in seconds and ensures consistent, reliable access while maintaining the same reporting methodology and metrics you rely on.
With a more powerful engine behind the scenes, we’ve also added some exciting new functionality and familiar features for a more consistent experience across the platform.
How it works
Key workflow enhancements and updates
- Dramatically faster load times: No more waiting or workarounds to view reports. Get immediate insights for your own analysis or to share with leadership.
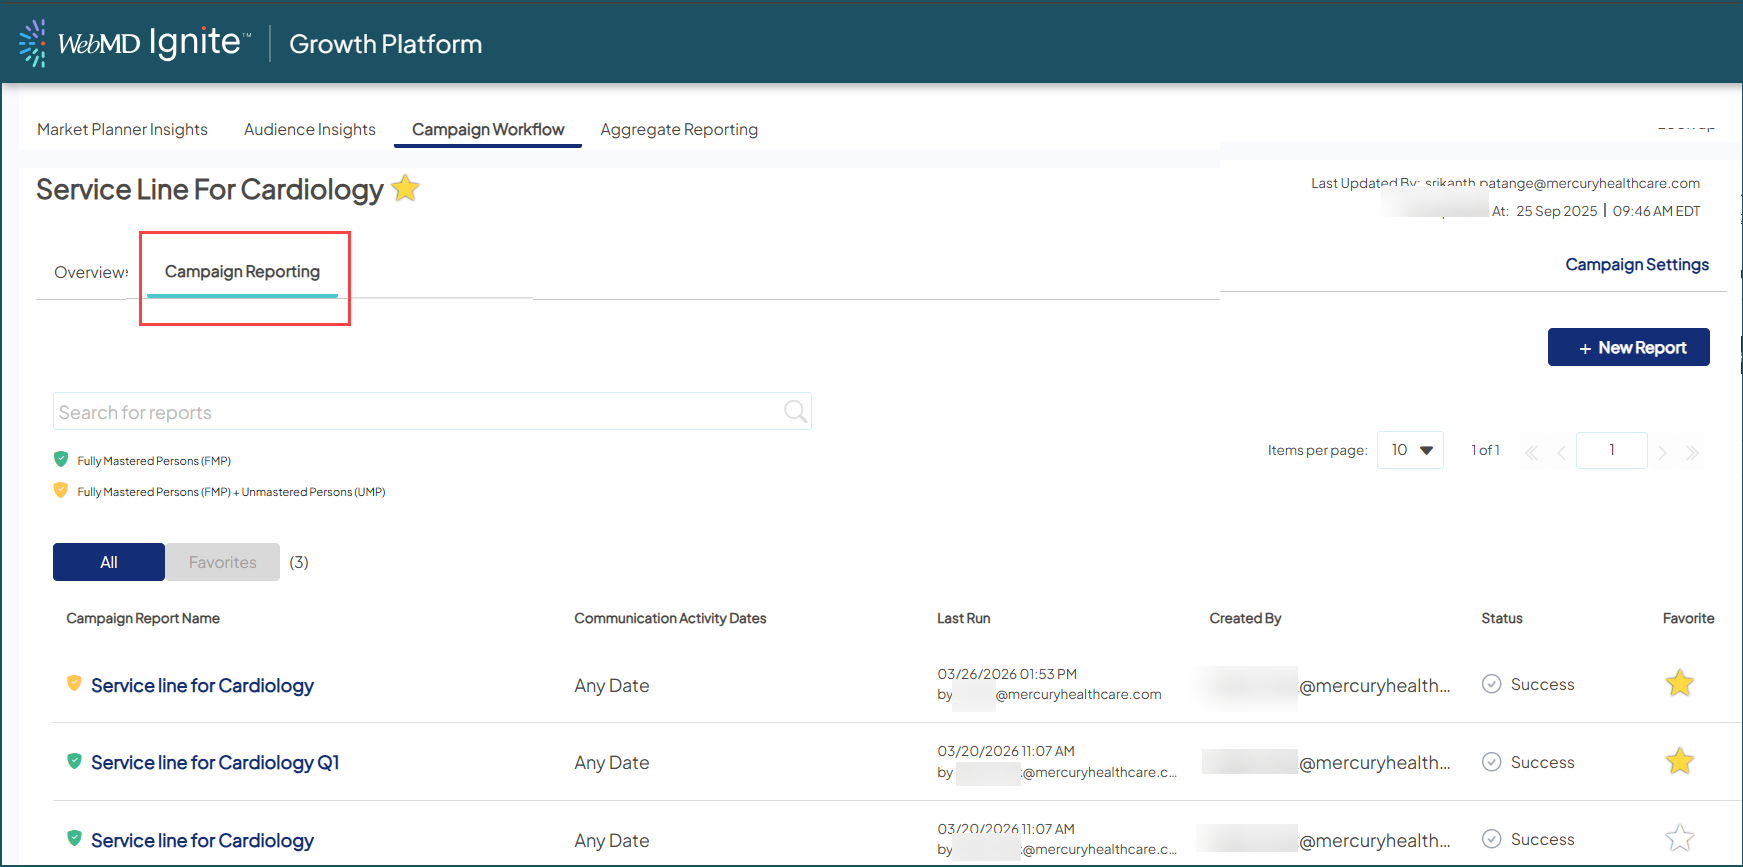
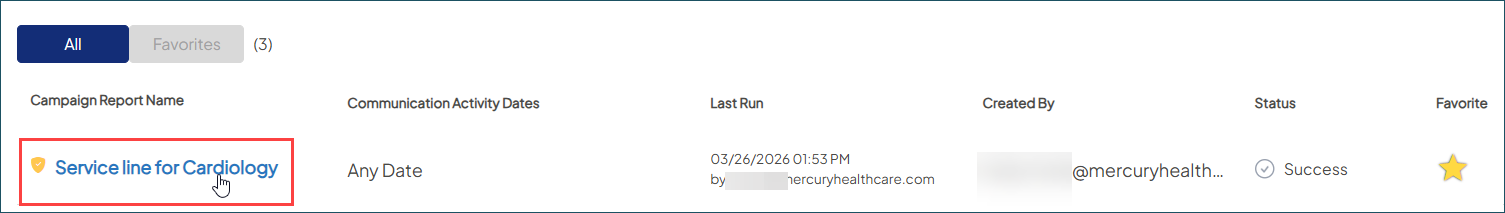
- Create and save multiple reports for a single campaign: In Campaign Workflow, clicking the Campaign Reporting tab for a specific campaign now takes you to a list of reports versus a single dashboard. Unlike previous session-based reporting, you can create and store multiple versions of a report that live here for continued reference.
This intuitive list view mirrors other parts of the platform like Audience Insights and Aggregate Reporting — complete with search bar, Favorites, and shield icons to identify Fully Mastered and Unmastered audience sets at a glance.
- Create once, access instantly: To populate your new list view (which will initially be empty), you’ll first need to create a new report.
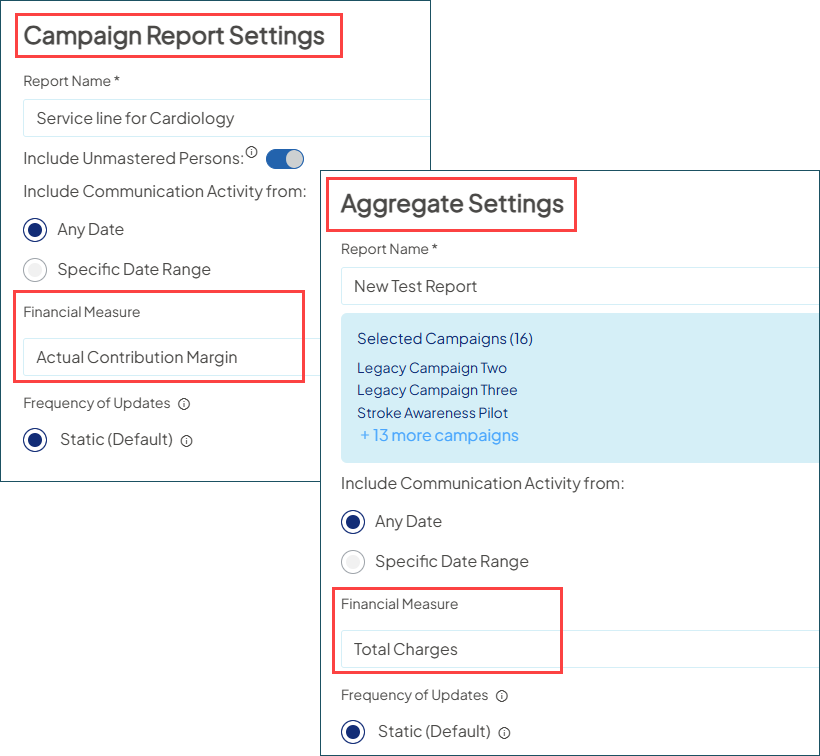
- Click the +New Report button to open the Campaign Report Settings window, which pulls in criteria from your Campaign Settings and is pre-populated with a report name you can modify as needed.
- Choose to include Unmastered Persons and/or communication activity dates — plus your organization’s preferred default financial measure, another enhancement with this release.
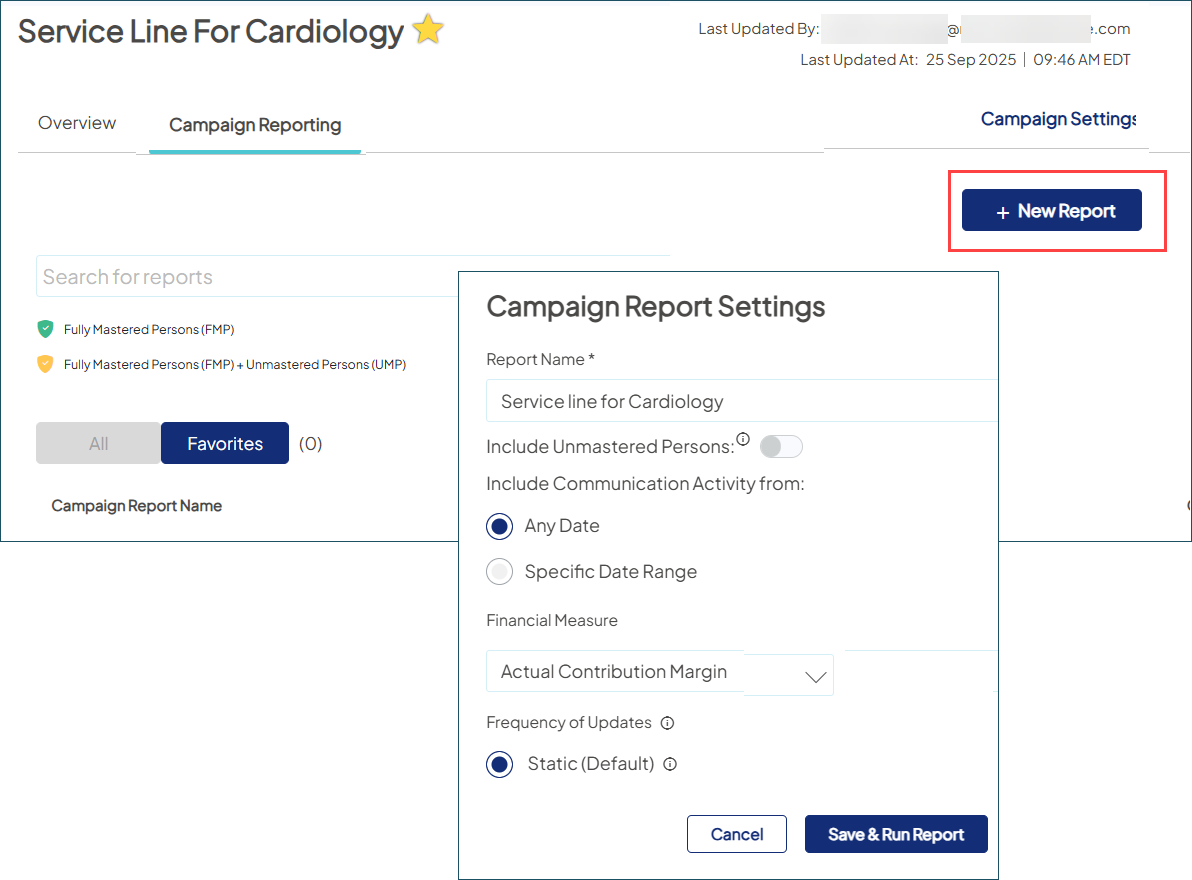
- Once you save and run the report, it will generate in just a few minutes. That version is then available for quick reference every time you return.
New features within your reports
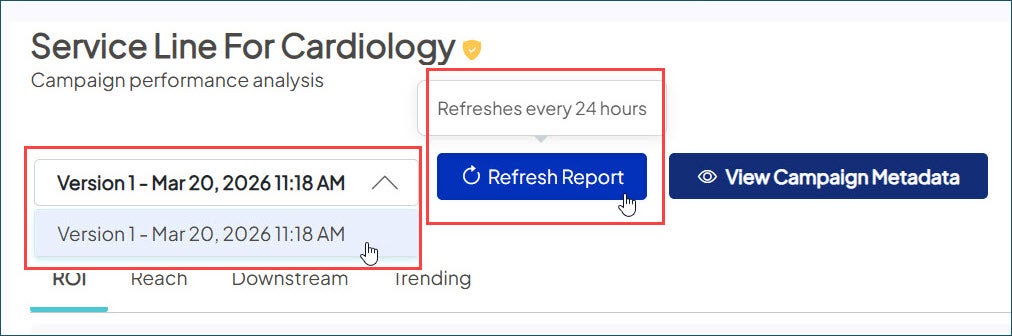
- On-demand refreshes: Need the latest numbers? You can manually refresh your data every 24 hours to ensure your report reflects the most recent campaign activity.
-
Version history: You're no longer limited to a single view of your reporting. Save multiple versions of the same report to capture the latest data, then use the dropdown to select date-stamped versions and jump between snapshots in time.
 Look for a frequency schedule enhancement in an upcoming release, which refreshes your reports automatically on a weekly, monthly, or quarterly basis.
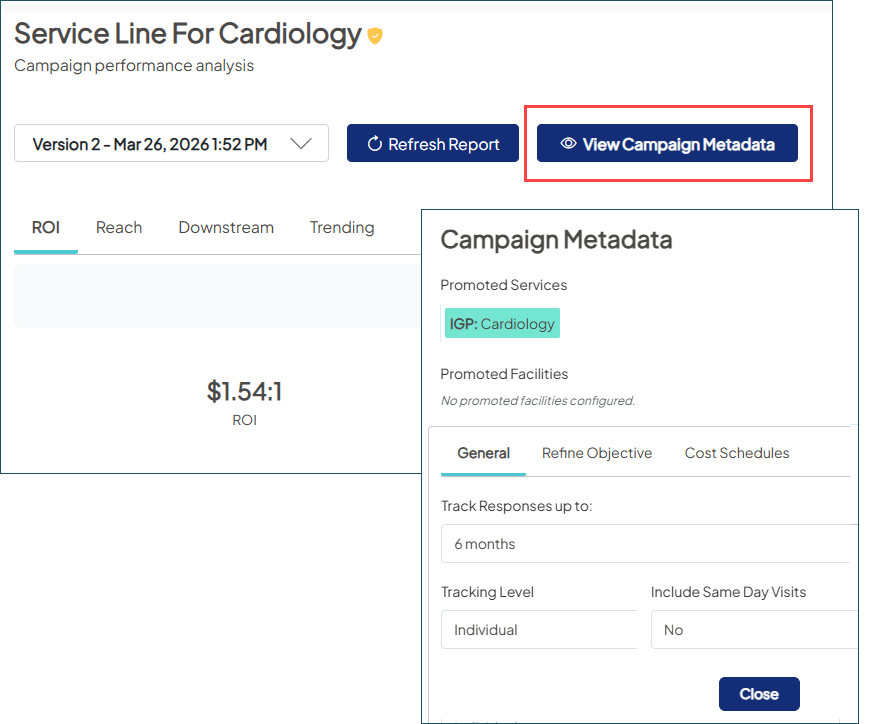
 - Verified report settings: Click the new Campaign Metadata button to see the promoted services and facilities, visit type, tracking levels, and more details pulled from your Campaign Settings at the time you created the report. This ensures you always have the full context behind the performance.
Continuity for your core analysis
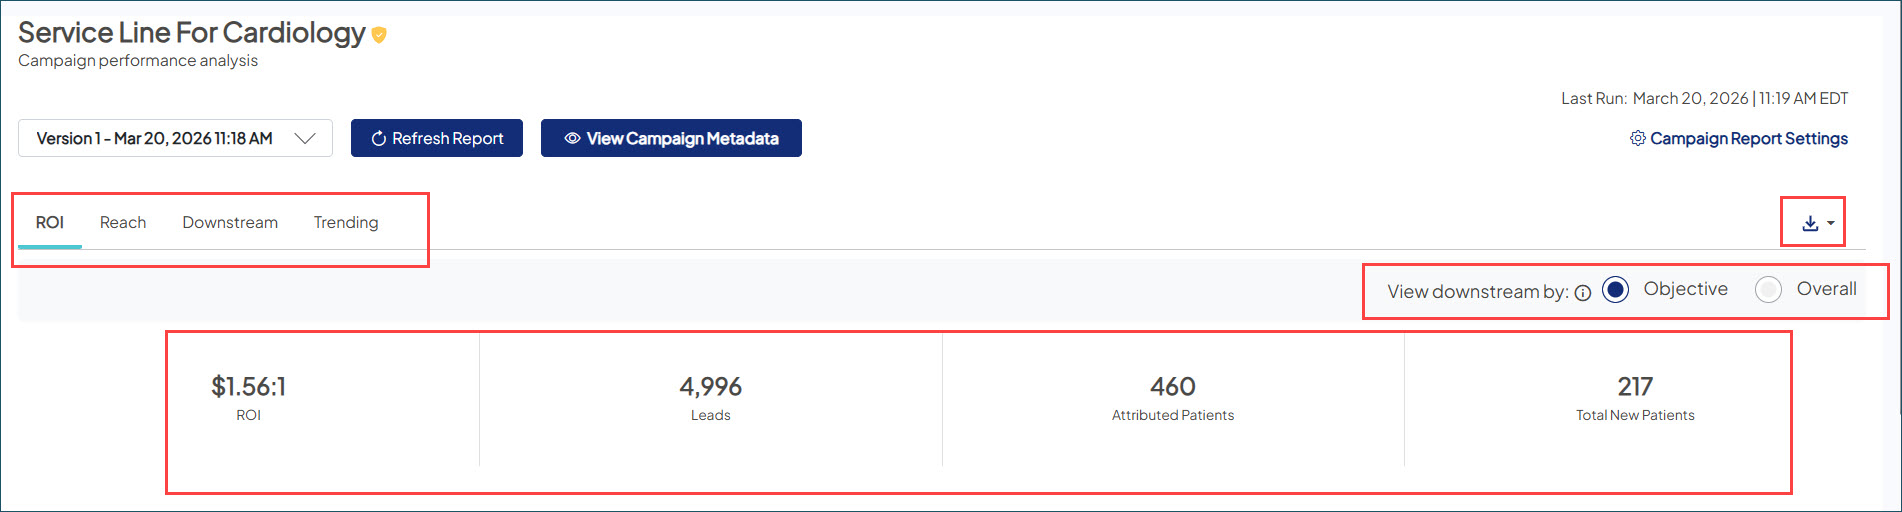
Your top-level KPIs and primary tabs — ROI, Reach, Downstream, and Trending — provide the exact same insights.. All charts and visuals have also been carried over, along with the Objective vs. Overall toggle to quickly switch views and polished PDF and XLS exports for executive-level presentations.
Streamlined for a more focused experience
Beyond the speed boost, we’ve refined the layout so you can prioritize the results that drive your strategy. We’ll also be reintroducing key functionality in upcoming releases that fits seamlessly into this new prioritized view.
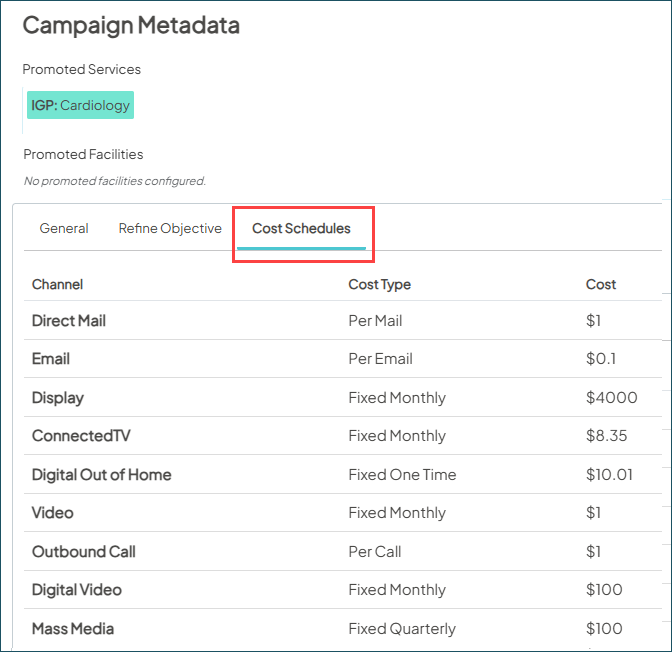
- Cost management: Entries from your campaign Cost Schedule are now pre-populated right in Campaign Metadata > Cost Schedules instead of having to navigate to a separate tab. To change the costs in your reporting, update the Cost Schedule in Campaign Workflow and either run a 24-hour refresh of your current report, or create a new report if you need the cost changes reflected immediately.
-
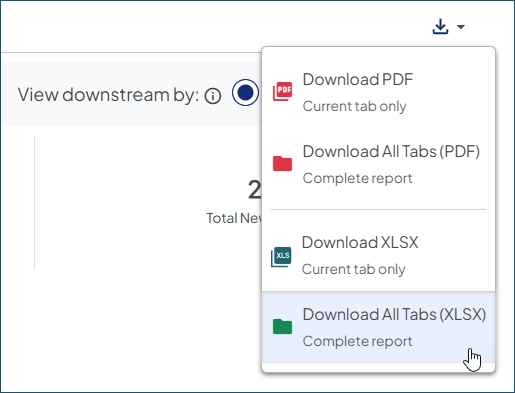
Data Extract tab: For immediate downloads, you can use any of the PDF and XLSX options to export all of your reporting row-level data — including the new Campaign Metadata — directly from the interface.
 Coming soon: We’re finalizing our Data Extracts feature to provide the same robust data capabilities you previously accessed as part of the more integrated experience. We’ll keep you updated as we approach the release.
 - QA Dashboard: We’ve temporarily removed this tab, which will be re-released in the future to support your data validation needs.
Why it matters
We’re committed to performance that keeps pace with your workflow. This upgrade delivers that critical speed and reliability, without sacrificing the analytical capabilities to optimize campaign success. It also lays a future-ready foundation, accelerating the delivery of more advanced features on the way.
Financial measure defaults: Get right to the results that matter
With this time-saving update, you have one less step to the reporting your organization values most.
What it is
This optional customization allows your organization to pre-set a specific financial metric as the standard view in both your single Campaign Reporting and Aggregate Reporting.
Previously, all reports defaulted to Expected Contribution Margin. If you had a different primary metric, that meant manually updating the Financial Measure filter every time your team opened or built a report. Now, you can have your preferred measure automatically selected from the start.
How it works
Requesting your default measure
Simply contact your Account Manager or submit a support ticket. Most requests are completed within 2-3 business days.
- Set at the platform level: Your chosen default applies to your entire organization, creating a consistent starting point for every user.
- Available options: Choose from Actual Contribution Margin, Actual Reimbursement, Expected Reimbursement, or Total Charges.
- If no change is requested: Your reports will continue to default to Expected Contribution Margin.
Updated in your reporting
As part of our move to high-performance campaign reporting, the financial measure has transitioned from a session-based filter to a foundational setting for all individual campaign reports, aligning them with Aggregate Reporting.
- Integrated into your workflow: Once your default is in place, you’ll find it pre-selected when you create a new report or view an existing one. This applies to both the Campaign Report Settings window for single reports and Aggregate Settings window for your multi-campaign views.
- Ready for immediate analysis: Your designated metric is applied to all financial and ROI calculations the moment you open a report — no more manual adjustments required.
- Maintain total flexibility: While the default provides your standard view, you still have the power to pivot. Just create a new report and select a different financial measure. Because these reports generate in minutes, you can quickly build a new view to see your data through a different lens.
Why it matters
This update ensures your reporting automatically reflects your organization’s specific accounting standards. By establishing a unified version of financial truth across every view, you save valuable time and can focus fully on the insights that drive your growth.
Sort, zoom, scroll for easier analysis
We’ve added two new enhancements to Aggregate Reporting and the new Campaign Reporting view, helping you navigate your results more efficiently and get a clearer view of performance.
What it is
Your reporting now includes:
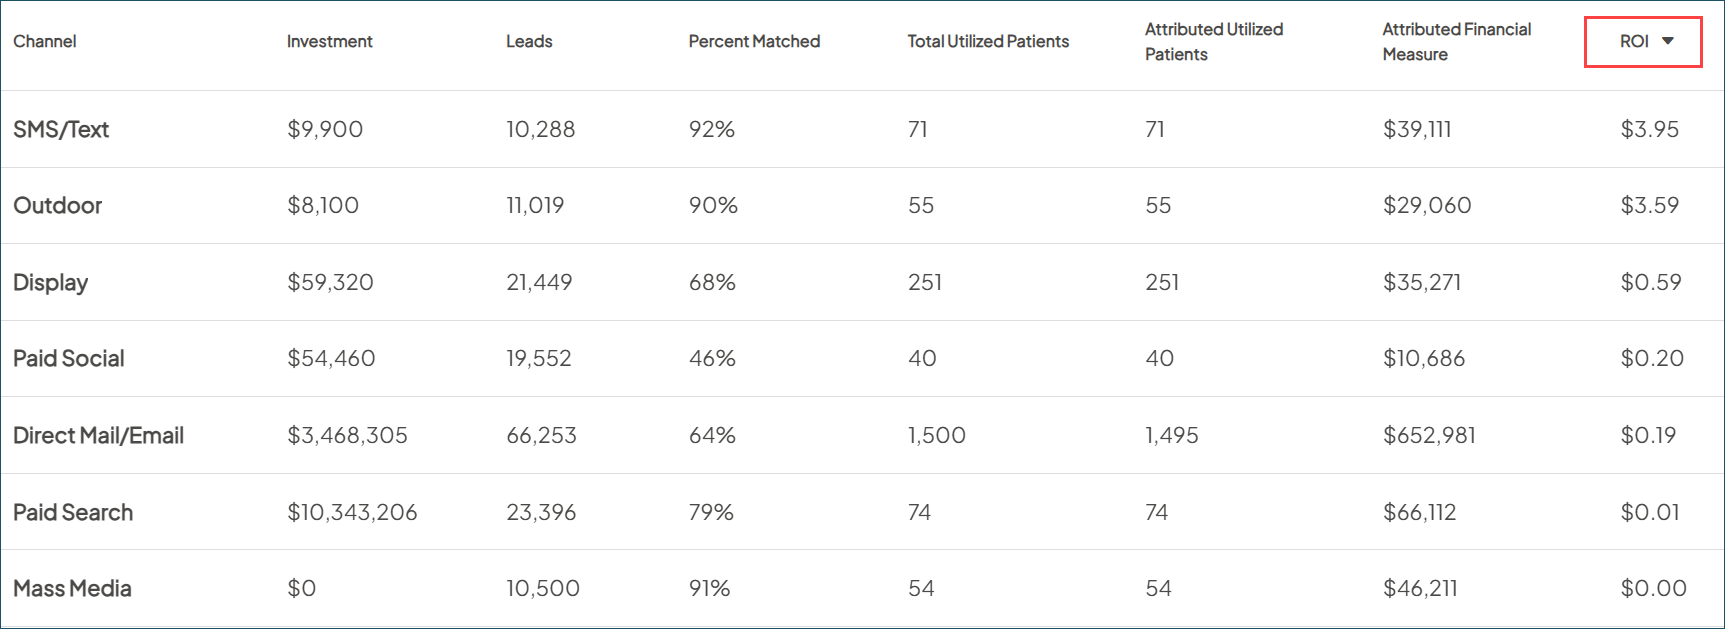
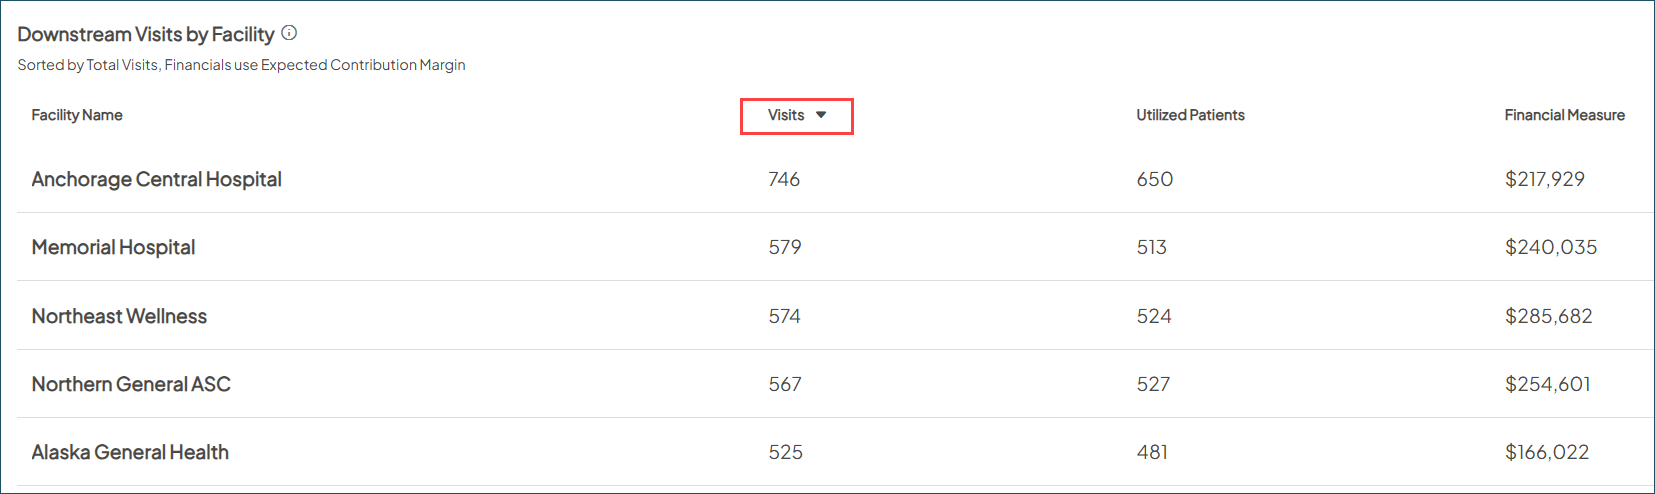
- Table sorting: Column headers are now sortable in tables across your reporting tabs. By default, they now also display your most recent results and highest-performing channels first.
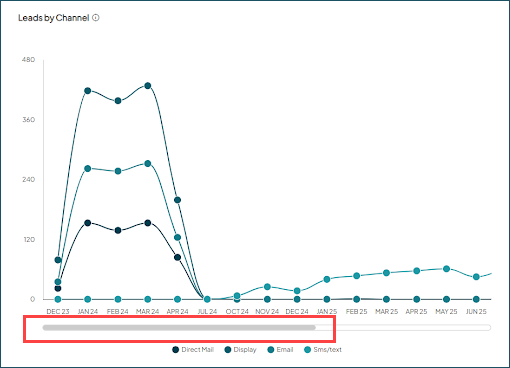
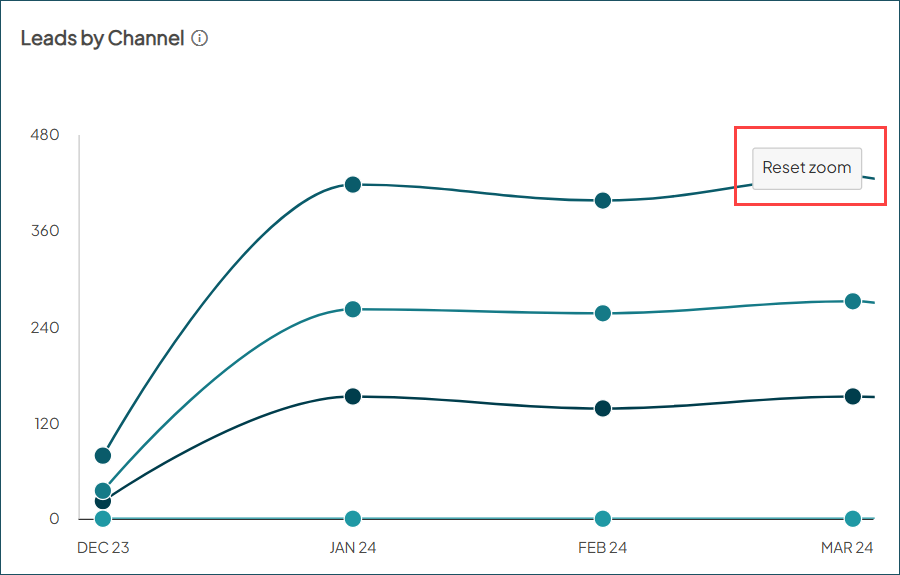
- Zoomable and scrollable trending charts: To better view long-term trends that span multiple years, these charts now feature an automatic scroll bar and allow you to zoom in on specific dates for a closer look.
- Preserved PDF export views: Your customized table sorts and zoomed-in chart selections (in the current tab) are captured exactly as is in your downloads to share with leadership.
How it works
Table sorting
Click column headers to manually toggle between ascending and descending views. Tables load to prioritize your most relevant data by default:
- ROI tab: Sorts by ROI, highest to lowest.
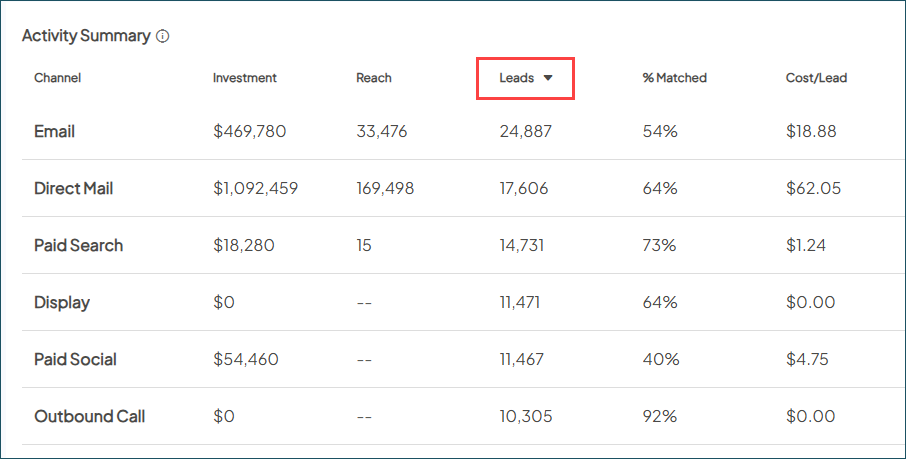
- Reach tab: Sorts by Leads, highest to lowest.
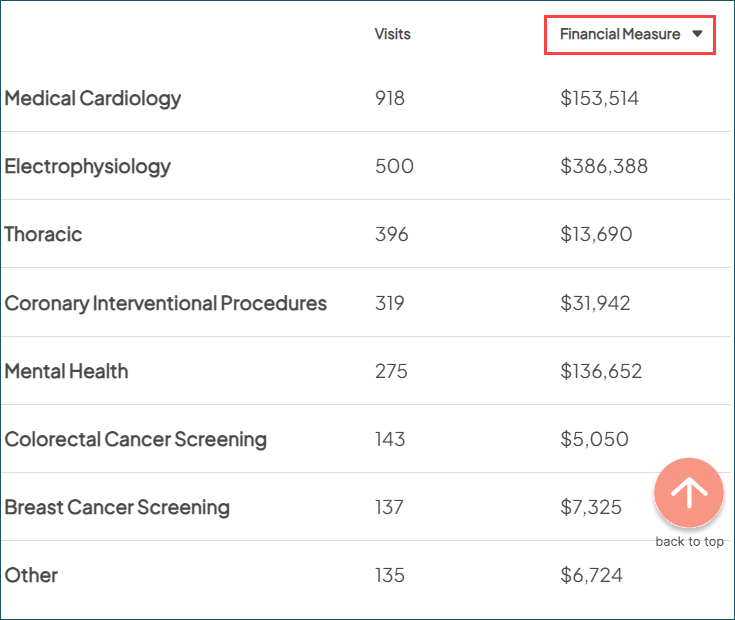
- Downstream tab: Performance tables sort by Financial Measure, while the Facility table sorts by Total Visits, highest to lowest.
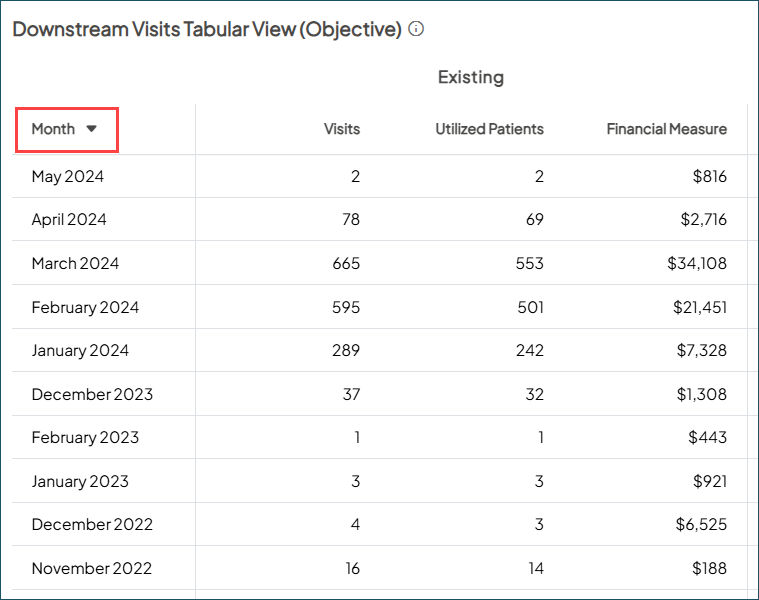
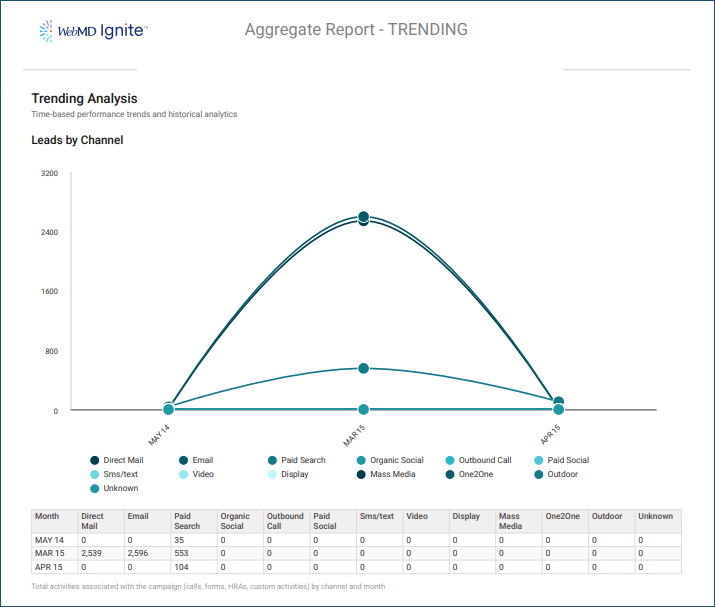
- Trending tab: Data tables sort by date, showing your most recent results
Trending zoom & scroll
The reporting interface provides more control over how you interact with the data:
- Automatic scrolling: If a chart contains a high volume of data points, a scroll bar appears at the bottom to ensure clear spacing between months.
- Manual zoom: To focus on a specific timeframe, click and drag your mouse over any area of the chart. The view will immediately zoom in on that selection.
- Reset view: To return to the full timeline, click the Reset zoom button in the top-right of the chart.
Exporting your view
Your customizations are preserved when exporting to PDF, allowing you to share the precise data views you’ve created.
- Table sorting: Your manual sorting choices will be preserved whether you export the current tab or all.
- Trending chart zooms: To capture a specific zoomed-in chart view, you can currently export the current tab.
Why it matters
These enhancements continue our commitment to refining your Aggregate Reporting experience. With results that are more interactive and easier to navigate, you can better surface the insights that drive your strategy.