In this release: New target audience attributes | Audience sync end dates | XLS exports

Expanded insights to power personalization
We’ve added and refined high-value attributes for targeting in Audience Insights, providing the precision you need to engage your diverse populations.
What it is
To better align with modern clinical and social data standards, targeting criteria now includes:
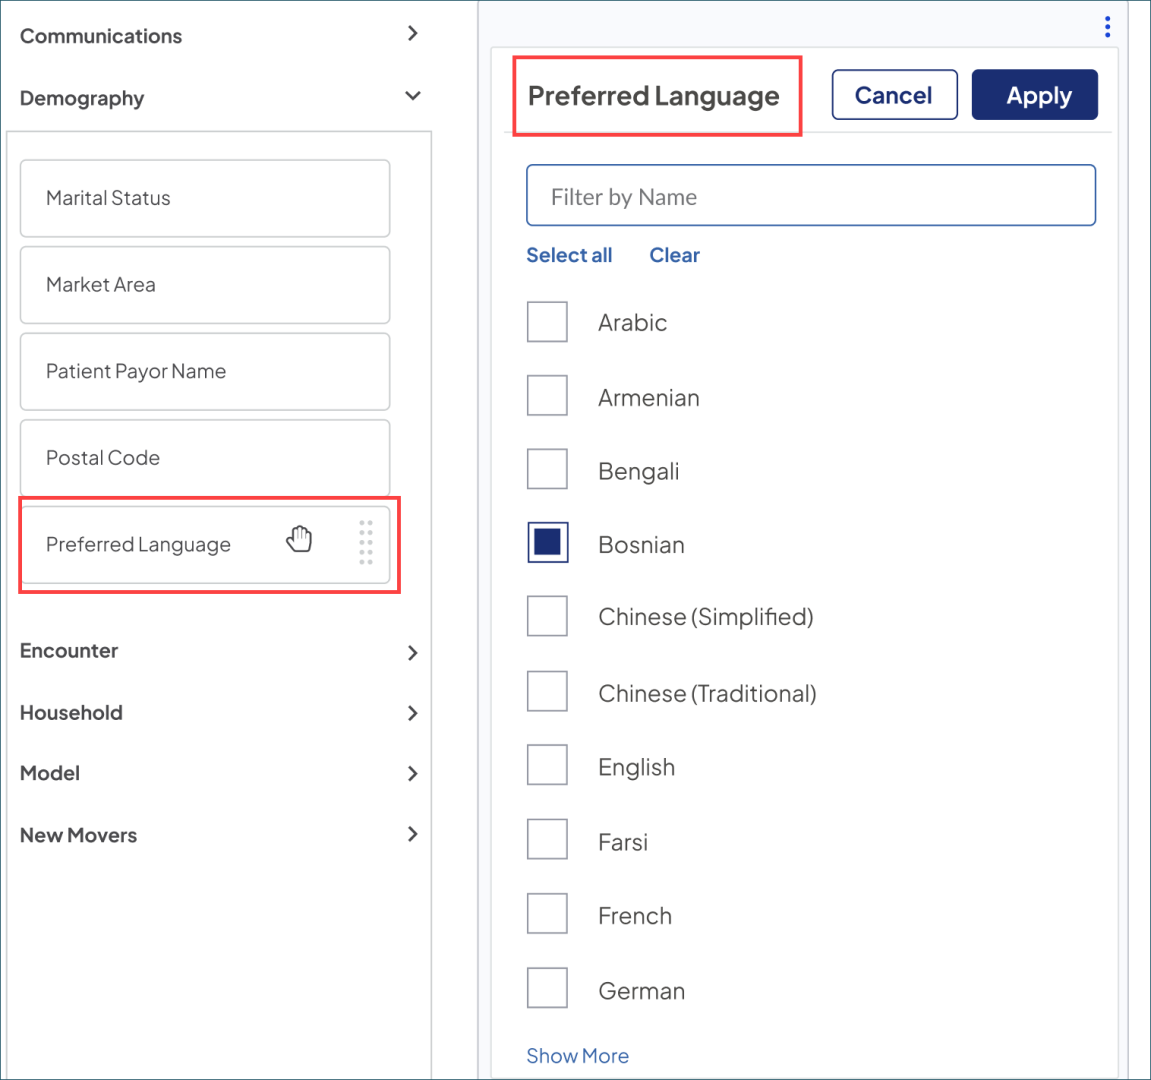
- Preferred Language (enhanced): Based on your feedback, we’ve upgraded the Language attribute to leverage your health system’s own patient data instead of 3rd party consumer data. This direct source will allow you to confidently deliver messaging in a patient’s language of choice.
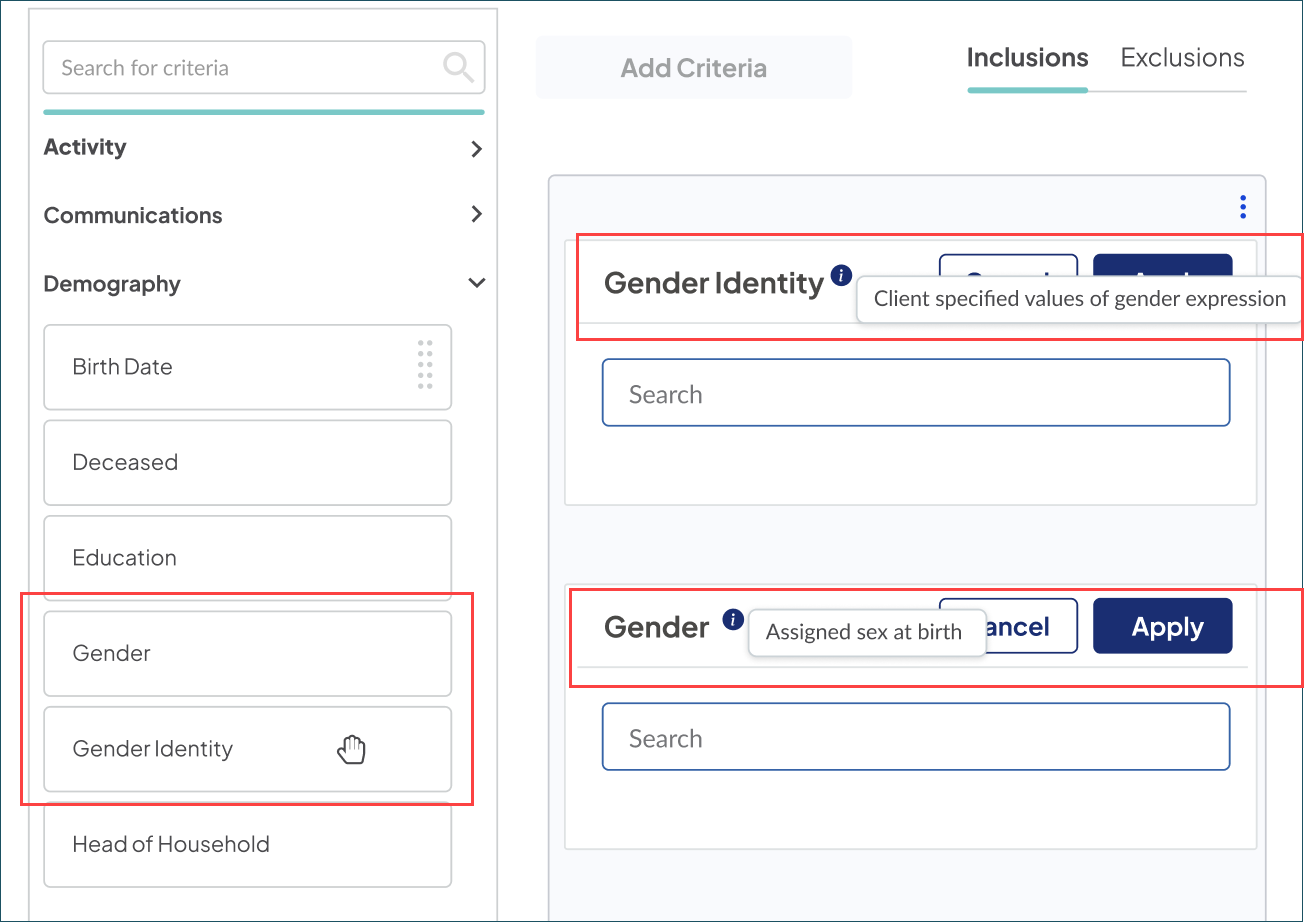
- Gender Identity (new): This new attribute reflects a patient’s self-reported gender expression, as captured by your organization. With visibility into how patients identify, you can foster more respectful and personalized outreach.
- Gender (refined): This existing attribute is now more clearly defined as Assigned Sex at Birth. Distinguishing this clinical data point from the new Gender Identity ensures precise targeting for sex-specific outreach.
How it works
Activating your insights
Enable the Preferred Language and Gender Identity audience criteria by updating your organization’s encounter data feed.
- Download the latest Encounter Data Submission Guide, which includes the new fields and formatting requirements.
- Existing audiences using the Language criteria have been automatically updated to Preferred Language. Results for this enhanced attribute will initially be but will re-populate as soon as you start submitting patient data.
Using the criteria in your audiences
- Under the Demography criteria, Language has been updated to Preferred Language. Filter by a standardized set of over 25 languages based on your available data.
- Gender and Gender Identity now sit back-to-back alphabetically, allowing you to choose between clinical and social expression for your targeting.
-
Hover over the info icons for a clear explanation of each criteria.
-
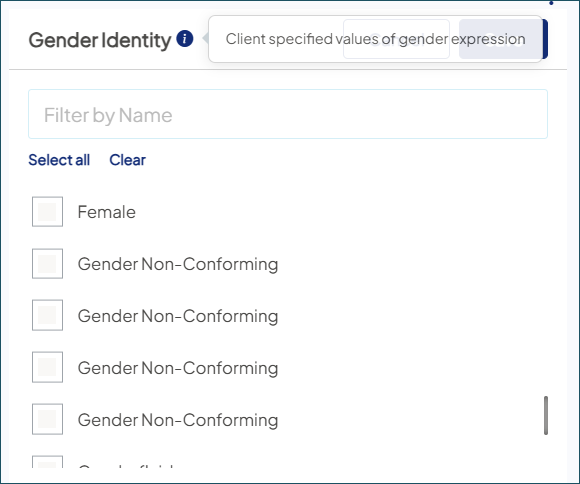
Filter options for Gender Identity are client-defined, so the values provided in your data submission determine exactly what you see in the platform.
-
Downloading your audience data
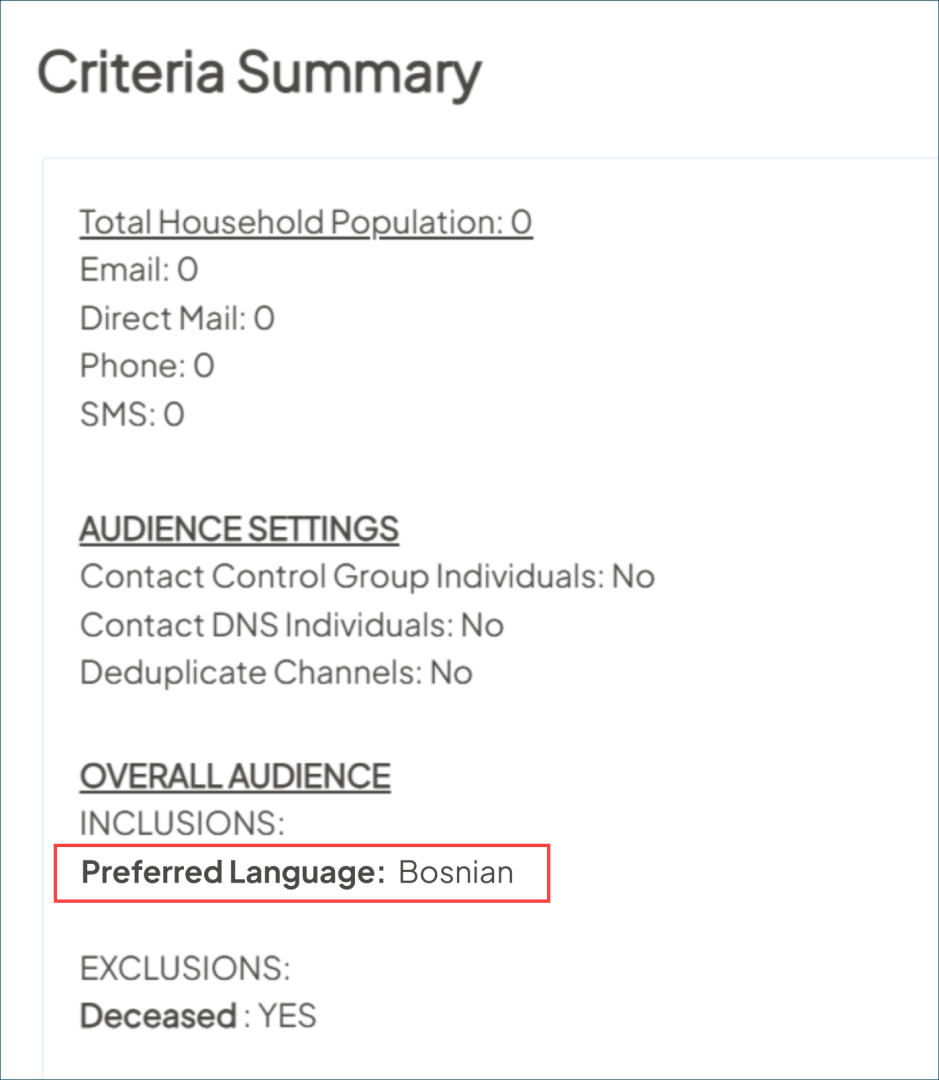
The Criteria Summary and Demographic Report exports now include the expanded attributes for closer look at your audience.
Viewing individual person records
For users with the Lookup access role, the attributes are now visible on each profile:
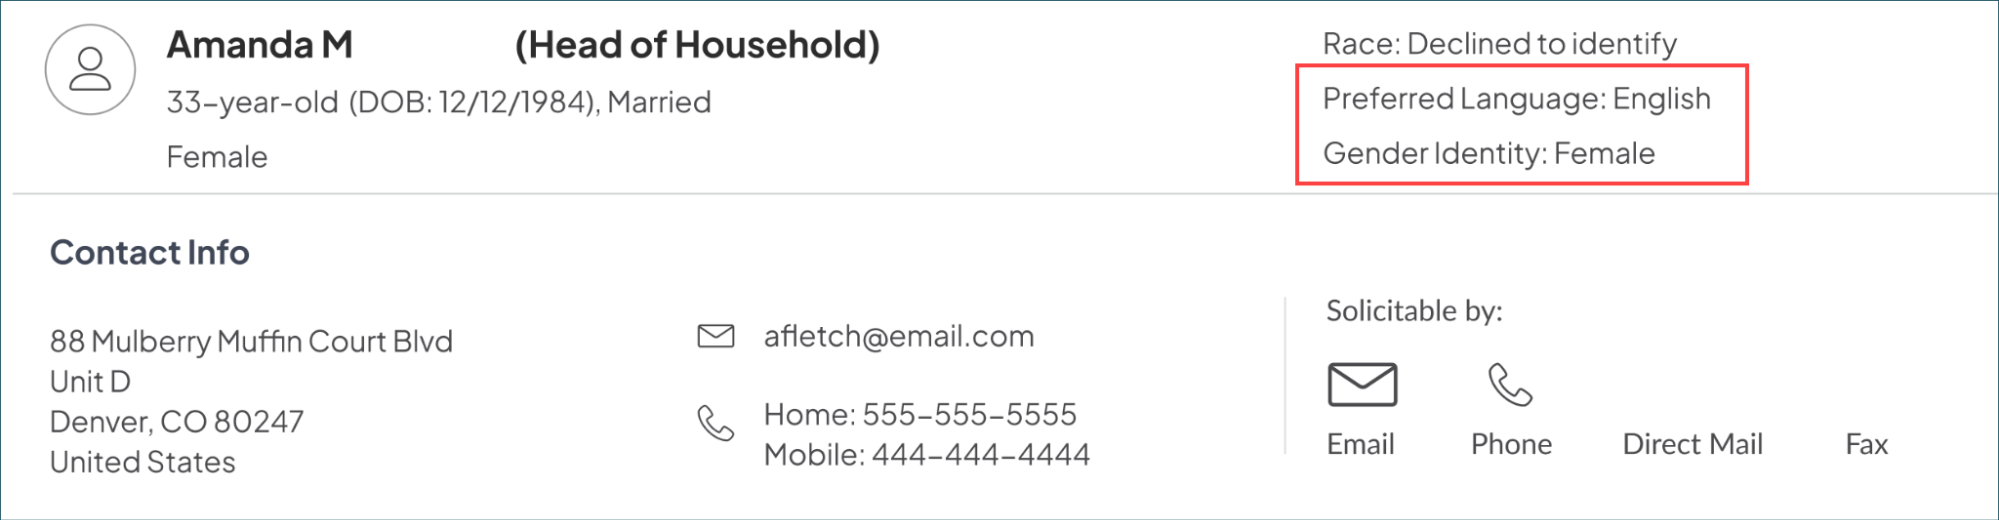
Why it matters
These expanded and enhanced attributes serve as strategic building blocks for more resonant outreach, helping you move from broad targeting to meaningful, person-level engagement.
Streamline your workflow with end dates for all audience syncs
Following our recent update for newly created audiences, we’ve now added end dates to your existing syncs. This proactive process helps you keep Ignite Growth Platform and your marketing automation tools lean, clean, and running smoothly.
What it is
On March 3, 2026, we automatically assigned scheduled end dates to any active audience sync that had an indefinite timeline. With these clear cut-offs, you can stay ahead of your data management, while optimizing platform performance and the efficient use of your 3rd-party contact management systems.
How it works
You can view and manage dates for each of your active audiences in your Sync Settings. We’ve applied logic to non-managed campaign syncs so that they are properly ended with the ability to update. Syncs scheduled more recently have the following new end dates:
- Syncs scheduled 2x per week or less: End date is 365 days (I year) from this release date.
- Syncs scheduled 3x per week or more: End date is 183 days (6 months) from this release date.
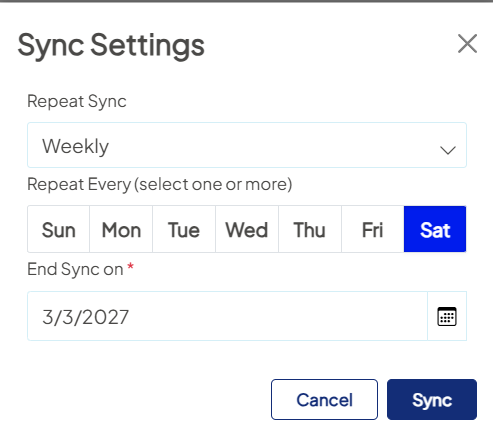
You maintain full control over these schedules. If an audience is evergreen or your campaign timeline changes, simply update or renew the end date for the specific sync.
Examples: Any existing audience sync created on or before 7/1/2025 has been assigned an end date of 3/3/2026 (you'll be able to see this end date in the platform or request a list of all your sync end dates).
For newer syncs created after 7/1/2025, end dates were calculated from the release date based on schedule frequency:
- A sync started 7/15/2025; frequency = 1x/week → End date: 3/3/2027 (3/3/2027 + 365 days).
- A sync started 7/15/2025; frequency = 4x/week → End date: 9/2/2026 (3/3/2026 + 183 days).
If you edit any syncs, the platform treats the edit date as “today” and lets you extend the end date. Example: edit date 05-01-2026:
- When sync schedule is <2x/week → New end date = 1/13/2026 (5/1/2026 + 183 days).
- When sync schedule is >3x/week → New end date = 5/1/2027 (5/01/2026 + 365 days).
Why it matters
- Faster platform: Reducing endless background syncs helps ensure an optimal experience for your team.
- Healthy integrations: Wrapping up older syncs helps prevent your marketing automation tools from hitting contact record limits and being hydrated with outdated data.
- Clean reporting: Ending syncs for completed campaigns stops the re-calculation of new audience members, providing a more accurate view of performance.
- Smarter syncing: Clear out forgotten or outdated syncs, so you can focus on your active audiences.
Aggregate Reporting: Dive deeper with XLS exports
Polished PDF exports gave you greater visibility. Your newest download option is all about flexibility, providing row-level detail for custom analysis outside your platform.
What it is
Export tables and metrics from Aggregate Reporting into a professionally formatted, multi-tab spreadsheet ready for deep-dive exploration.
How it works
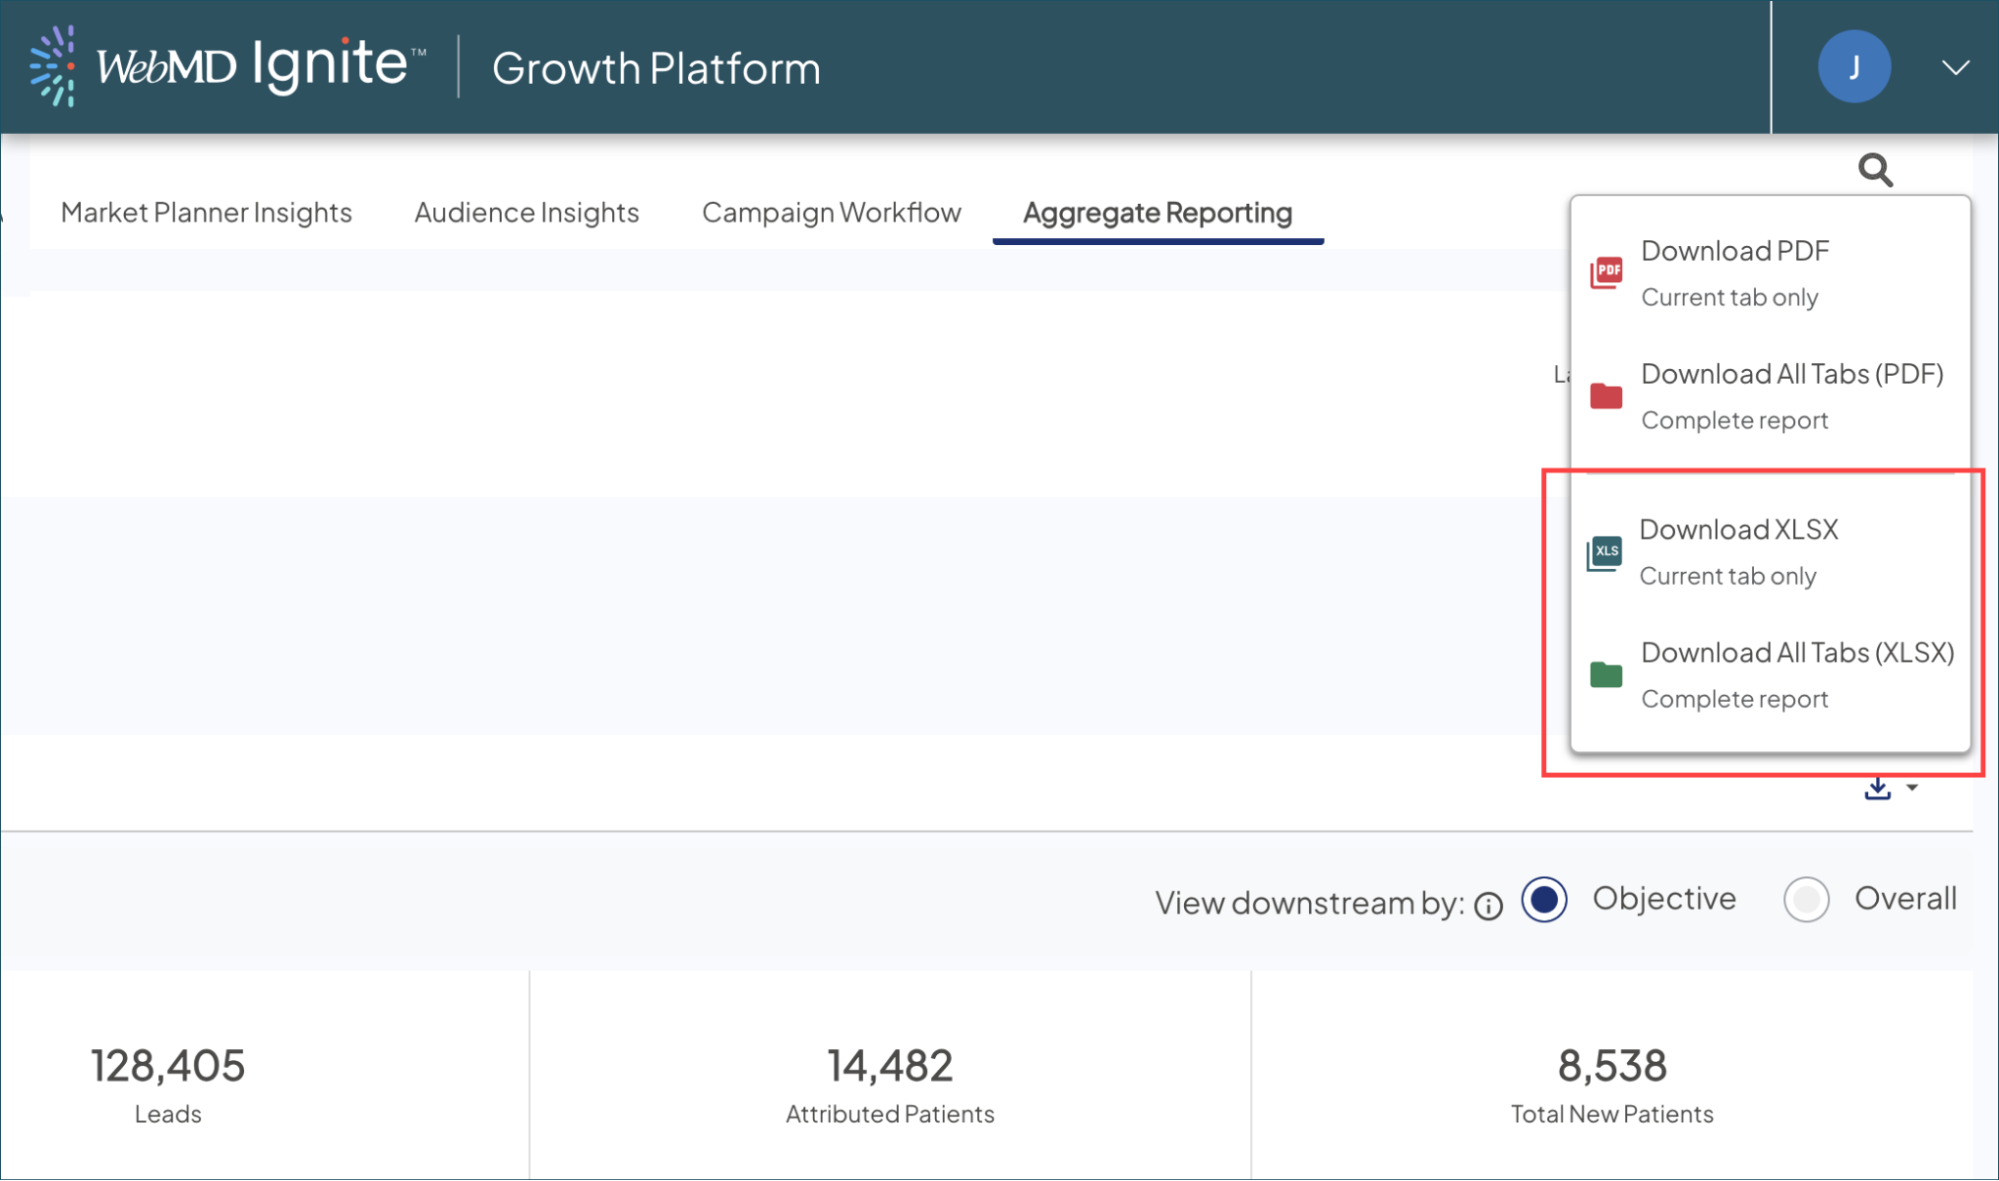
- Select the Download icon: Find it at the top right of any page within your Aggregate Report.
- Choose your export: Download the data from your current tab only, or bundle all tabs— ROI, Reach, Downstream, and Trending—into a single workbook.
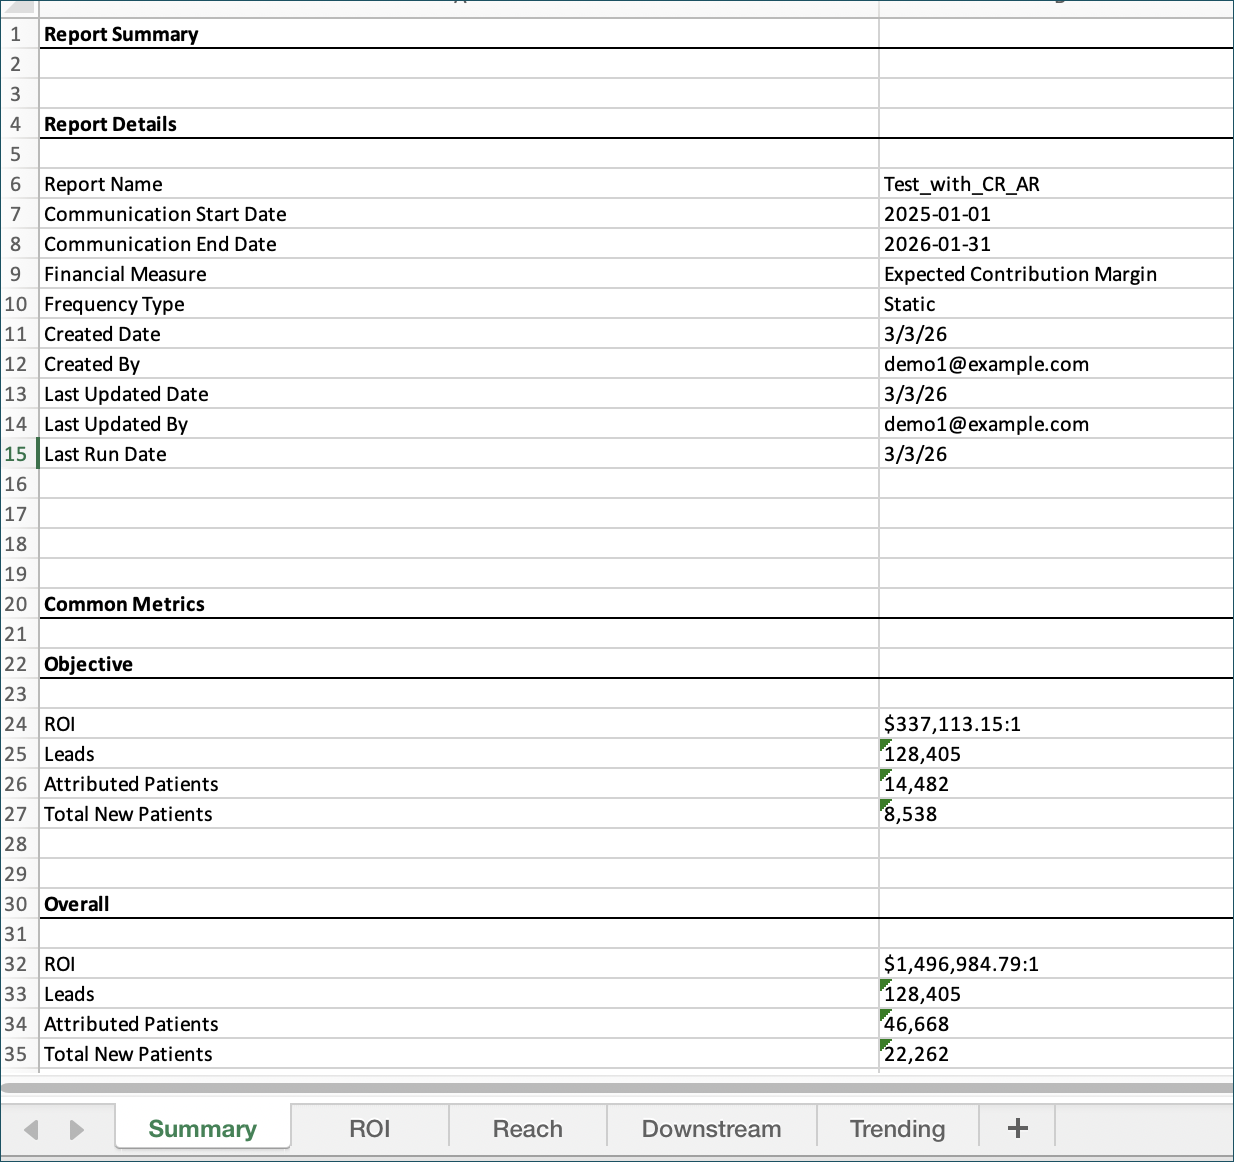
- Review the Summary tab: Every export includes a dedicated Summary sheet that captures both objective and overall criteria to provide full context for your offline analysis.
Why it matters
Exporting your dashboard metrics into a structured spreadsheet lets you analyze data your way. Whether you’re building pivot tables, combining results with internal models, or diving into trends across tabs, you can uncover the insights that directly inform your strategy.